The put/call ratio and investor adviser sentiment help to prevent me from making mistakes at market extremes. When the daily put/call ratio is 1.2 or higher there are too many people betting on a decline, and the market bounces. The ratio was above 1.0 yesterday, still showing a lot of bearish bets (more puts than calls). Similarly, when the Investors Intelligence poll shows many advisers to be bearish, the market tends to find support or rise. Recently we had a rare period when there were more bearish advisers than bullish advisers. This pattern gave me reassurance recently to stay long and follow the GMI. There are now more bulls than bears (43% vs 37%, but the number of bulls is far below the 50-55% level that typically occurs for long periods during advances. Thus these sentiment indicators reflect a lot of bearishness and suggest to me that there is more up-side to come. The one major negative indicator is the Worden T2108, now at 84%. Most of the time a reading of 90-92% occurs at market peaks. But given that most stocks have done poorly of late and are depressed, the fact that so many are now above their 40 day average price may not be considered to be extreme in the current rally.
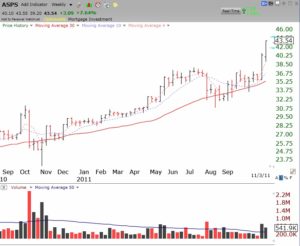
Check out the nice cup-with-handle break-out on ASPS last week. Note the high volume confirmation of the break above the handle. The trick is to find these winners just as they are breaking out. (Click on weekly chart to enlarge.)
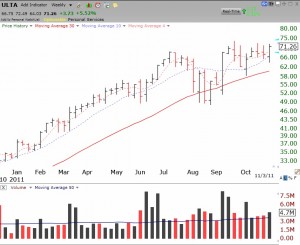
I am watching ULTA for a possible cup-with-handle break-out in the 73-74 area. I am using TC2000 to set an alert to tell me if ULTA gets near a break-out. (Click on weekly chart to enlarge.)


I am wondering about the short term diamond patterns forming on numerous indices , including short and long etfs – at both ends of the spectrum . Short funds have diamond near bottom , long at near the tops . Don’t recall having seen these many before . Study on same pattern has offered little direction or help .
ARMH might break out soon.