With IBD calling Tuesday’s rise on higher volume a follow-through day since the recent bottom, they now designate the markets as being in a confirmed up-trend. My indicators are still a long way from saying that, as Tuesday was the 15th day of the current QQQ short term down-trend. IBD has been quite good at calling the trend change, so I will have to wait to see if they are correct this time. However, they always caution that while all up-trends begin with a follow-through day, not all follow-through days lead to a solid up-trend.
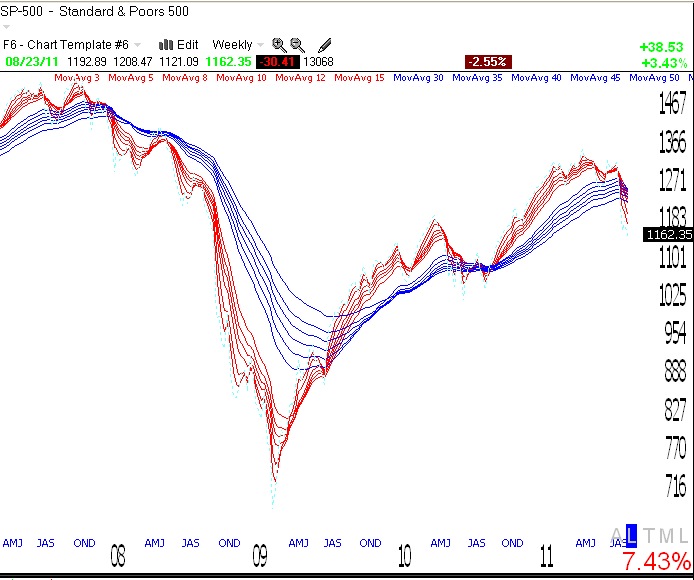
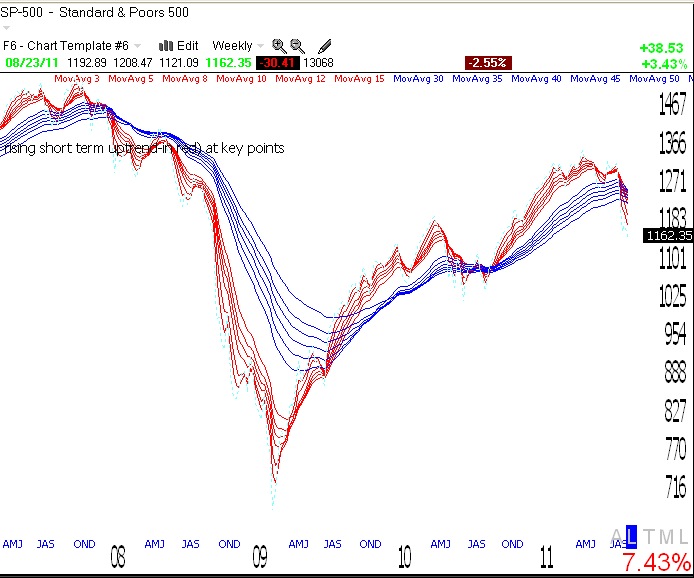
Only time will tell if this new base will hold. I remain almost 100% in cash. This weekly GMMA chart of the S&P 500 index still looks pretty ominous, with the shorter term averages (red) descending below the longer term averages (blue). Click on chart to enlarge.
Yes — I was shocked to see ‘market in uptrend’ call. I thought an uptrend required a confirmation day. I thought bottoms took at least 3 month bases. If this is the bottom then IBD just made the call of the decade. All I see is relief rally short covering. We shall see.
If you are an IBD subscriber, you can go to their website, investors.com, and click on their end of day TV report and they will show you with charts why they changed their call on the market.
Most of the major averages have been respecting the August lows, so far, except for one: The DJ-20 Transportation Index. This could be the fly in the ointment near term. As goes the the DJ-20 so goes the DJ-30? We shall see.