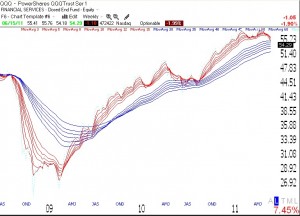
I remain in cash and hedged. No bottom is in sight. As the chart below shows, the shorter term weekly averages (red lines) are just starting to touch the longer term weekly averages (blue). The current weakness is far less than what occurred last year. Note that in the sustained bear market decline in 2008, the shorter averages were consistently below the longer term averages. We are far away from that pattern. Click on chart to enlarge.
