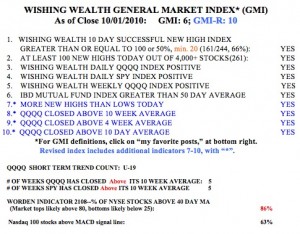
While the GMI and GMI-R remain at maximum values, there are signs this 19 day old QQQQ short term up-trend is weakening. First, the Worden T2108 indicator is in overbought territory, at 86%. In a few instances T2108 has hit 90%, but always at market tops.  This does not mean that a big decline subsequently ensures, only that things cool off for a while. Furthermore, only 63% of the Nasdaq 100 stocks closed with their daily MACD above its signal line, down from 82% last Friday. The daily MACD (12/26/9) is sensitive to the short term trend. The QQQQ and SPY index ETF’s have now closed above their 10 week averages for 5 weeks. So, the longer term trend is still up. So, we appear to be facing some short term weakness within a longer term up-trend. As I have been writing, we may get weakness in the indexes at the beginning of October until we earnings come out. The tough decision is whether to ride out the weakness or to cut back positions until it is over. I do not have a clear answer, but I am unwilling to give back all of the gains form the past few weeks. My university pension remains 100% invested and I will not touch that now. I may move stops up or buy some puts for insurance on my positions.
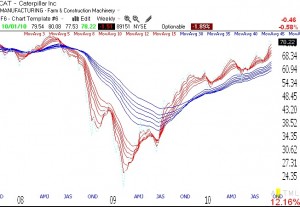
Last Monday, I introduced the concept of Red White and Blue (RWB) charts which is the pattern of rocket stocks. Interestingly, there are even some RWB stocks among three Dow 30 stocks: CAT, DD, MCD. So, sometimes even the big-cap, nonspeculative stocks can show consistent strength. Below is the chart for CAT.
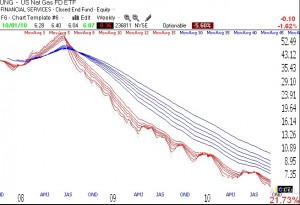
A few months ago I thought I saw a bottom in UNG, but I was wrong. The weekly chart below shows an incredible submarine stock pattern (BWR). What a great stock to have shorted the past two years. I would not consider buying UNG until the shorter term averages (red lines) rise above the longer term averages and it becomes a RWB chart pattern.

