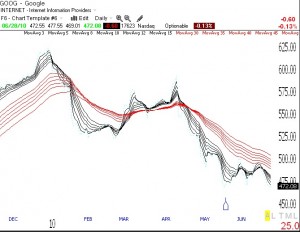
Market remains in a short term down-trend. I remain mostly in cash and short. Yesterday I wrote that GOOG came up in my submarine scan. This Guppy Multiple Moving Average daily chart of GOOG (click on to enlarge) shows a clear down-trend, with all short term averages (black) below longer term averages (red).

Dr. Wish,
Can you describe how you scale the guppy moving average chart on Telechart? I have not been able to scale my chart to look like the charts you post. Thanks!
Steve: I simply add all of the exponential moving averages to the chart and make the prices white, like the background, so they are not visible. Contact me at silentknight@wishingwealthblog.com. if you have more questions.
It looks the longer term moving averages are roughly 30 days longer than the short term ones. Can you specify what time period the red moving average lines are?
Thanks!
All GMMA averages: 3,5,8,10,12,15; 30,35,40,45,50,60