I have noticed that during market up-trends, stocks tend to rise in anticipation of the release of good earnings. Once the results come out and after the immediate reaction, many stocks tend to regroup and often decline, until they begin to rise as the next quarter’s earnings season approaches. We are now in the period when many stocks have reported and we may be in the refractory period when stocks consolidate or decline. Regardless of the true story underlying recent market action, it is clear to me that my indicators are weakening and that the coming week could cause a serious deterioration in the GMI and GMI-R. If a short term down-trend begins, we never know how long it will last. We have to wait for definitive signs of a new up-trend.
So, here are the facts as I see them now. First, many of the stocks that led this advance are breaking down or failed to hold new highs reached recently (GOOG, ISRG, GMCR,to name a few I have traded). Even AAPL, the leader of the tech sector, could not hold new high ground last week. (AAPL remains in an up-trend.) 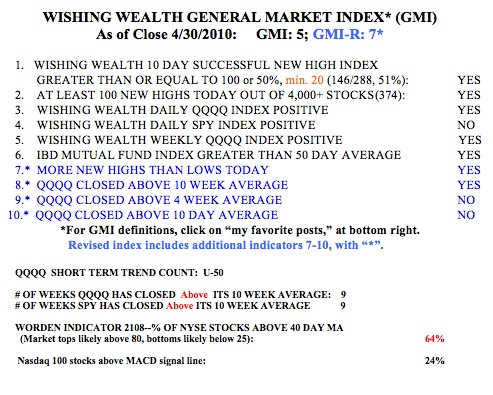 Then, the Worden T2108 Indicator began to break down, now at 64%, and is in a down-trend. This pendulum of the market is an excellent indicator of market extremes. Having held around 80% since early March, it finally has begun to decline. Many market declines bottom out when T2108 is around 20%. (T2108 measures the percentage of NYSE stocks that closed above their average price over the past 40 days. If a stock is trading below its average price over the past 40 days, one might think of it as a sign of weakness.) I also monitor the percentage of Nasdaq 100 stocks whose daily MACD (12/26/9) is above its signal line. That percentage is now at 24%, lowest since last February and is another sign of short term weakness. The GMI is at 5 and the GMI-R is at 7. (The QQQQ short term up-trend completed its 50th day on Friday.) A further market decline next week could reduce these values quickly, but I try not to jump the gun.
I told you that to hedge my long positions I had purchased call options on gold (GLD) and on the 3X Tech Stock Short ETF (TYP) that rises as tech stocks fall. Both of these positions advanced last week, minimizing declines I had in a few remaining long positions.
As long as the general market indexes remain in up-trends (and this could change next week), I do not like to short stocks. But I wanted to alert you to a scan I ran using TC2007 to find “submarines,” stocks that appear to be entering a major down-trend, according to certain technical patterns I watch. Because I look for fallen leaders to short, this scan was limited to stocks in my TC2007 watchlist that contains present/past IBD100 or New America stocks, published by IBD. Note that stocks typically begin declines before the fundamental reasons become public. Therefore, when I short, I rely solely on the technical patterns. I was so surprised to see some of the stocks that came up in this scan that I thought I would post the list. If I owned any of these stocks (which I would not, because they are below critical levels I follow), I would move my sell stops up, hedge them with puts, or sell them outright. I do not buy “bargains” that have declined far from their tops. This is not a recommendation, just intended to teach you how technical analysis can be used to reduce risk.
Here is the list of 13 stocks: MSTR, SWN,CVLT,GILD,ATHN,PWRD,NTES,GS,ABVT,SYKE,GOOG,SQM,MCFE. Some of these stocks had terrible days last week but did show up in my scans before those days. To my surprise, GS and GOOG are on the list. I was especially interested in the fact that two stocks in the same industry showed up with ominous similar chart patters, PWRD and NTES. This “naked” weekly chart of PWRD,without prices, shows more clearly the pattern of key weekly moving averages. 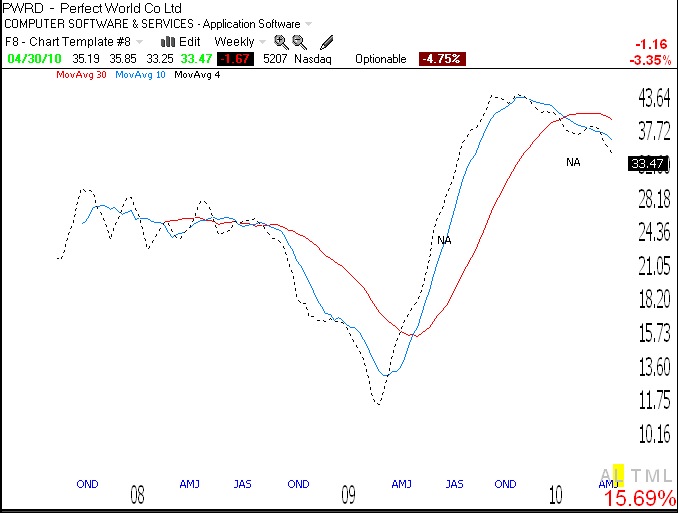 (NA represents about when the stock was written up in IBD’s New America column.) When the shorter averages (4 dotted, 10 blue) are below the longer term average (30 red) which itself is beginning to curve down, it suggests to me that the prior up-trend is over and a new down-trend is likely. The end of the up-trend should be evident to even eyes unaccustomed to technical analysis. When shorting, I like it if multiple stocks in the same industry are failing, indicating a potential sector-wide decline. (Both NTES and PWRD are Chinese online gaming stocks.) Over 2 years ago, I wrote about an impending meltdown in the banking sector when I saw how many financial stocks were giving me similar sell signals. With regards to this list of stocks, maybe I am wrong this time….
Looking through price action of IBD 100 stocks this weekend, NFLX, IDSA, VIT, DECK, KMGB, KWR, AIXG, CMG, NETL, ATHR, JSG, PTI, VLTR, LZ, EZPW, BIG, DBRN, NUS, SANM, CPLA, CM, among others are showing weakness. Some have wild swings and big black candlesticks, which occur during breakdown.