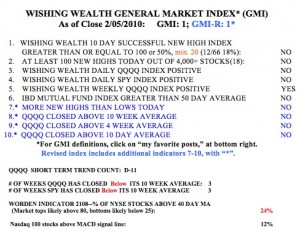
For the first time since early November, there were more new lows than new highs in my universe of 4,000 stocks on Friday. Furthermore, the Worden T2108 indicator is getting near the level (below 20%) where declines sometimes end. Friday was the 11th day of the current QQQQ short term down-trend. We are either at the beginning of a major decline, or near the end of a short term correction. The best course for me is to wait for the market to tip its hand. The GMI remains at
1 (of 6) and the GMI-R is now also at 1 (of 10).  T2108 is now at 24%. The only promising action on Friday was that the volume on major market index ETF’s was very high as they rebounded at the end of the day. They need to hold Friday’s lows to suggest the possibility of a sustained up-trend.
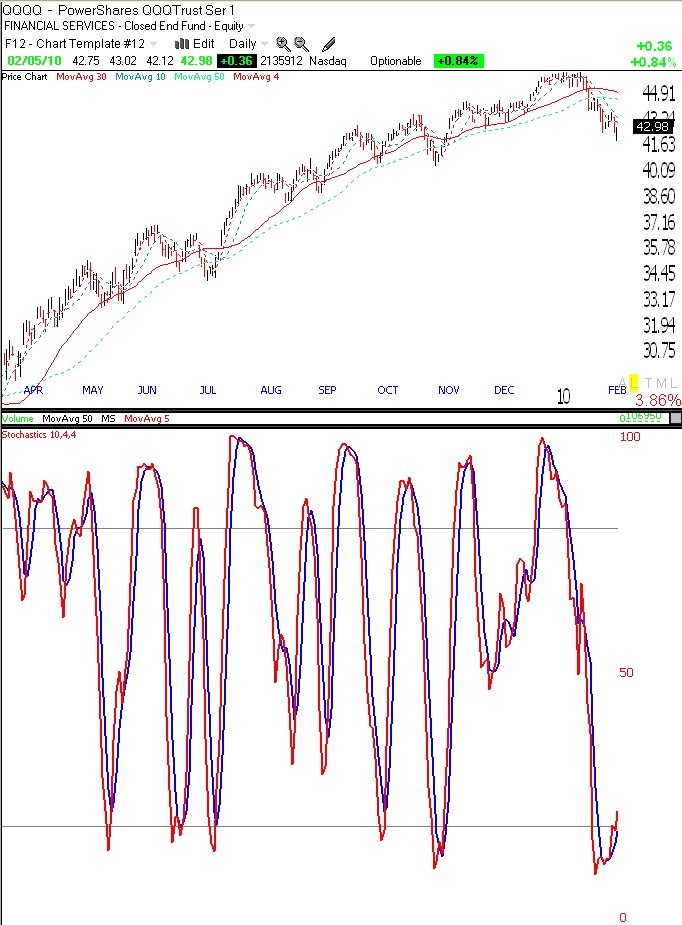
I have been focusing of late on the stochastic statistic as an indication of whether a stock or index is in oversold territory. The stochastic for x period, measures where the current price is compared with the range over period x. A stochastic of 10 measures the close versus its high and low over the prior 10 periods. A stochastic reading of 100 means that the current price is at the high price over that period. A reading of zero, means that the current price is at the bottom of the 10 period range. Typically, a reading below 20 means an oversold condition. I look at a daily stochastic 10,4,4. This measures a 10 day period, with one plotted line (red) representing the 4 day moving average of the stochastic, and a second plotted line (blue) representing a 4 day moving average of the first line. Below is the 10,4,4, daily stochastic of the QQQQ. Note that the stochastic is rebounding from way below 20 and that prior bounces have occurred at this level. We are either going to have a bounce or a prolonged down-turn.

Given that we may have a decade of sideways movement like the 70s, does this type of market have much rocket stocks reaching new highs opportunities?
Seems it’s more of a market for trading indicies using market timing.