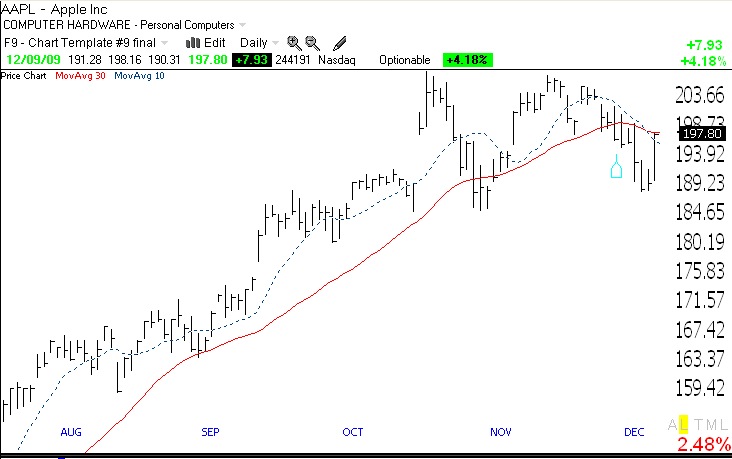
Since I posted a few days ago a Guppy chart showing short term weakness in AAPL, the stock declined and then bounced on Wednesday. The stock did reach a very low level on its daily stochastics (10,4,4) indicator and a reversal of the short term down-trend is still possible. However, I am waiting for a close back above its critical 30 day average to go long on the stock. The daily chart below shows that the 30 day average (in red) is curving down and for the first time since the rise began last March the 10 day average (dotted line) is below its 30 day average. Both of these short term indicators are bearish. A close above 198.11 today would turn me bullish on the stock. A bounce down off of the 30 day average and a close below 198.11 would make me very cautious on the stock. If the stock starts down today, it could have formed a short term double top, having met strong resistance around 208. If/when it closes above 208-209, the up-trend will have likely resumed. Remember though, AAPL remains in a longer term Stage 2 weekly up-trend.

IMHO, $appl is sideways till the SPX can break 1120. The recent bounce was off a descending elliote wave.