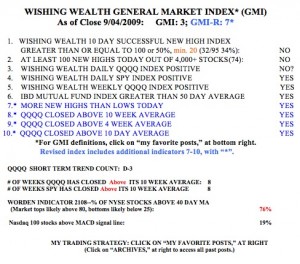
Sometimes my long term and short term indicators do not agree with each other. This is one of those times. My short term daily trend indicator for the QQQQ turned down last week while my long term indicators remain up. So, I went to cash in my short term trading account but stayed long in my more conservative pension mutual fund accounts. The GMI
closed the week at 3, after hitting a reading of 2, mid-week. But the more sensitive GMI-R closed at 7, reflecting the bounce at the end of the week.  The SPY and QQQQ have closed above their 10 week averages for 8 weeks, a strong sign of long term strength. But only 19% of the NASDAQ 100 stocks closed with their daily MACD above its signal line, a sign of short term weakness. The Worden T2108 indicator is now at 76%, off of its high around 90% several weeks ago, but not low enough to typically signal a bottom to the recent weakness. However, a close of the QQQQ on Tuesday above Friday’s close would turn my Daily QQQQ indicator positive, and add a point to the GMI and GMI-R.
With (often perilous) October on the horizon, I am content to be on the sidelines in cash in my trading IRA, and to let the market sort things out.
could you post updates as these changes to GMI/GMIR occur? this info is much less relevant/useful after the fact…