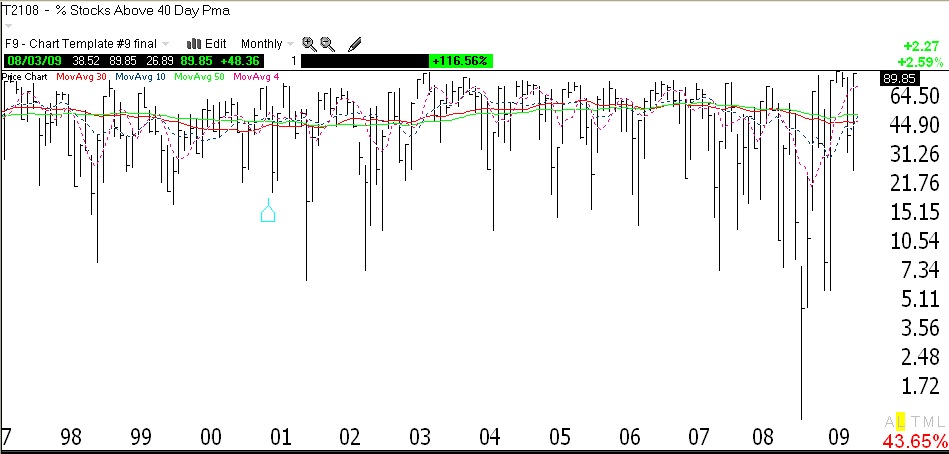
I am a little concerned that the Worden T2108 Indicator is at 90%, about as high as it gets. It measures the percentage of NYSE stocks above their 40 day simple moving average. See weekly chart of T2108 below. (Click on chart to enlarge.) It may be time for me to hold off on new purchases. However, the GMI is now 6 of 6. I am therefore almost 100% long, as the longer term trends remain up. I am also watching the ETF’s UNG and USO, as gas and oil may have bottomed.
how long has the rally been since march 9th? can you give us an update on the 32-33 (?) comparison?