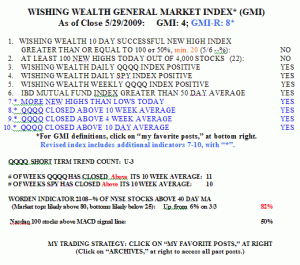
If calling the short term trend of the market were easy, we would all be rich and retired. Last week, my short term QQQQ indicator gave me a head fake and turned my daily trend count down. That new downtrend lasted for two days and then the up-trend resumed. However, I had indicated at the time that my short and long term QQQQ indicators were giving inconsistent readings, with the long term indicator remaining in an up-trend. The new short term up-trend just completed its 3rd day.
The more that I analyze the market, the more I become convinced that I should rely on the longer term weekly trends to determine the market trend (see discussion of the Guppy chart below). The QQQQ has been above its critical 10 week average for 11 weeks and the SPY for 10 weeks. But I have told you that I am a chicken, and would rather go to cash at the first sign of weakness and re-enter the market later, after the dust has cleared. I actually have other, personal reasons, for why I am unwilling to enter the market right now. I cannot trade successfully when I am stressed by other concerns. The only stock I own is ASIA, with a close stop loss.
I probably could trade more profitably if I just follow my GMI and go long when it is 4 or above, like now.  The GMI is back to 4 (of 6) and the more sensitive GMI-R is 8 (of 10). With only 22 stocks in my universe of 4,000 stocks trading at 52 week highs on Friday, it will be a long time before all of the components in the GMI turn positive. Five of the 22 new highs were on the IBD100 lists I track: STAR, NTES, SNDA, SXCI and RVSN. Of note, 50% of the Nasdaq 100 stocks now have a MACD indicator above its signal line. The MACD measures several moving averages and is very sensitive to changes in trend. When the MACD crosses above its signal line, the stock is gaining technical strength. The Worden T2108 indicator is now back to 82%, a high level at which the market can remain for months without turning down.
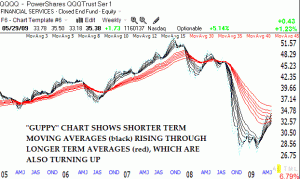
I am presenting a new “Guppy” chart of the weekly QQQQ trends. I learned about Mr. Guppy’s charts from his book , listed to the lower right of my blog.  This Guppy weekly chart plots multiple moving averages, here 12, and bull moves show up with the shorter averages (black) consistently above the longer term averages (red), with plenty of white space separating them.
This weekly chart of the QQQQ clearly shows the character of the tech market since 2005. The decline that began in late 2007 has bottomed out and the shorter term averages are moving up through the longer term averages. In addition, and most significant, the longer term averages (red) have stopped declining, and some are beginning to curve around. While I feel safest to be long when the shorter averages are all above the rising longer term averages, I believe that it is now prudent for me to wade slowly back into this market with my most conservative money. Note that I am willing to do so because I am also willing to get out again if the shorter term averages turn down again.
I am a trend following swing trader, trying to catch the multi-month up-swings like those that occurred in 2005 and 2006-2007. The key to success for me is to be out of the market (and lose little $$) when the black lines are below the red lines. If we could all ignore everything the media pundits and others are saying and focus only on what the market trend is showing us, we could retire with fat accounts and far fewer emotional swings. Remember, Nicolas Darvas had to dance around the world far from Wall Street, to trade his way to riches. Let me know if you agree.
I hope you have speedy and positive resolution to what is bringing stress in your life stress.
I have moved long again in QLD with the break above 35.5. I will add to my position with continued strength. The SPX moving and sustaining above 950 would be a good confirmation of more upside to come. I am hearing a lot of ‘top callers’ all over the place similar to the ‘bottom callers’ last year. The trend is clearly moving up which means I will only go long or stand on the sidelines. I do feel there is a bit more risk here but that has to do with my initial QLD targets (36.85, 40 & 45) based upon percentage from the bottom, whole numbers and trendlines. We have already blasted through the first target but I will look at tightening up my stops at 40 & 45 if we begin to struggle there. I also like to keep a close eye on the charts of QQQQ & QID to look for important resistance that exists on any chart.
Suggestions:
1. As you do not seem to update the site daily, would it be possible to show an updated GMI/GMR-R and the “Worden T2108”?
2. A chart of the GMI/GMI-R and the Worden T2108 would provide a interesting perspective.
That said, your site is one of my required daily stops … Thank you!
I plan to resume daily posting soon. However, if I do not post, it is safe to assume no changes have occurred in the GMI and GMI-R.
Give somebody the to a site about the,