I have written a number of times that one can ignore the fundamentals and all of the media pundits and just let the market tell us what it is likely to do. When you are crossing the street and a truck comes bearing down on you at high speed, you should not argue with the fact that it is there. You should not wait in the street for the truck to stop and/or exclaim incredulously that it should not be there. One needs to move quickly and get out of the way or jump on board the truck, if that is the goal.
I have been in cash for all of the major declines since 1995. (I also avoided the 1987 debacle.) I have never been caught married to my long positions, arguing with the market or hoping that a decline will end. No one can detect a bottom until sometime after it has occurred. Why do people look to experts to predict the market when none of them predicted the current decline! Experts are really great at explaining to us after the fact, all of the reasons why the market declined. When someone can tell me the reasons before the decline occurs, then I will listen.
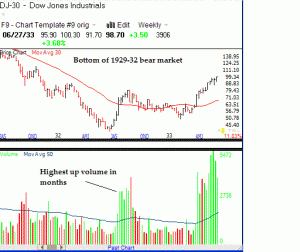
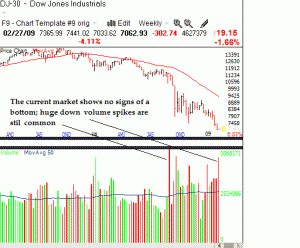
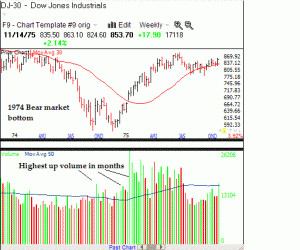
So, what can the market tell us about how bear markets have ended? I showed you several posts ago that the current market is tracking somewhere between the 1929-1932 and 1974 bear markets. How did these huge declines end? It turns out that they showed amazingly similar characteristics. Each of the declines ended when the the volume on the down weeks (red vertical lines at the bottom of the chart) tended to decline followed by several large volume up weeks (green spikes) that were bigger than any that had occurred in months.
The blue line in these charts is the 50 week moving average of volume. Note the many green spikes above the blue line after the initial bottom occurred in 1932. Later in 1933, after a successful re-test of the bottom, there were even larger green spikes in up volume, showing more buyers coming in.
In 1974 we see a similar pattern. Right after the bottom there was a huge green spike and several weeks later, after the re-test, we saw a number of even larger green spikes, just like we saw in 1933, when people became more confident of the earlier bottom.
It should be evident now, that both of these bear markets ended with weeks of relatively low down volume (red spikes below the blue line) followed by a huge green spike soon after the bottom, followed by a number of green spikes several months later, after a re-test.

The current market could not be further away from this pattern. The red spikes are unceasing, even as recent as last week, indicating that the selling is nowhere near exhausted. In contrast, the green spikes (up weeks) tend to be lower than the red spikes. This is not a market set to bottom like the prior bears. In fact, it looks to me like it is just getting started………..
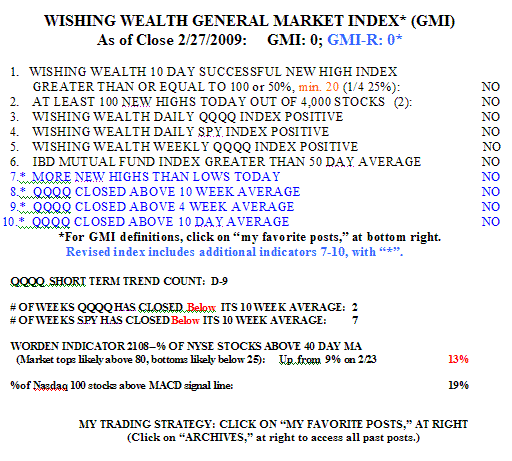
The GMI and GM I-R are still zero. The QQQQ short term down-trend is now in its ninth day (D-9) within its longer term weekly down-trend. There were 2 new highs and 560 new lows in my universe of 4,000 stocks on Friday. This number of new daily lows is dwarfed by the numbers that occurred last November (as high as 2,185). So this decline is not yet as bloody as the one last year.
I have learned not to fight this down-trend and therefore remain mainly in cash. I do own some puts in my IRA. Gone are the days when the GMI could remain at 5 of 6 for months. The key is to conserve cash so as to be able to go long when those days return–and they will……


ERIC, good observation on comparisons with the past. True that we are on down trend. However, you are really “predicting” that the this market will keep going down, and down much further. I hope you are wrong, but no one really knows! I spoketh and my word hath gone forth!
I am not making any predictions. I am simply identifying the current trend as down. The trend can change at anytime.
Eric, your blog is indeed a Trend Indicator! Thanks for sharing it with us. Curious if you still hold TSYS or did the stop order get you out? It seems it will go down to $7.50 (gap)–reason why I haven’t bought it. Thus far the needle in the hay stack has perforated the CUP and seems to’ve broken the handle, too.
I am still holding a little TSYS. Its long term support is at the 30 week average, around $7.39. My shorts are doing great. It is much more profitable to ride the down-trend.
Here’s another LOOKING BACK (in Wall Street Journal):
http://finance.yahoo.com/retirement/article/106668/Stocks-Will-Indicate-When-the-Tide-Is-Turning
Dr. Wish I am 200% short based on my own indicators and your GMI. Days like today are fun for me! Thanks!
I don’t know how anyone can miss the market trend. There are so many pundits on TV and in the printed media who just can’t figure it out. Good job Dr. Wish.
We’re certainly in panic mode now. All my market risk indicators are dead in the water. We need some type of high volume buying day to arrest this decline. There isn’t one in sight, yet.
I think today is the exclamation market that the market has more than broken the 2008 market lows. It the sign that the bottom fishers are throwing in the towel.
Dr. Wish, I am a bit surprised that you don’t have AutoZone (AZO) on your stock buy list.
Eric, Mkt trend is down, but what trend do you think ALGT will go? NEWS:(Dow Jones)–The U.S. airline industry is shrinking routes this year, as fewer passengers fly. But one small carrier, Allegiant Travel Company (ALGT), is on a growth track. The plucky Las Vegas company, which caters to vacation-minded travelers in small towns across the country, hasn’t flinched in the face of economic recession and fluctuating jet fuel prices. The airline on Tuesday reported that February passenger traffic on scheduled flights rose nearly 10%, with load factors, or the number of full seats per plane, rising to 90.2%. Last month, the airline said it would add service in May to a new market, Los Angeles, from 12 of the 62 cities it serves. The airline hopes to avoid fare wars that have hit the recession-wounded industry; only two of Allegiant’s routes, both in California, compete directly with other airlines, Chief Executive Maurice Gallagher said in an interview. Allegiant stock traded recently at $34.44, midway between its 52-week high of $49.06 and low of $15.89. Analysts reporting to Thomson First Call, on average, are looking for the shares to rise to nearly $55 in the next 12 months, as the airline adds revenue while keeping costs low.