It’s is great that Jon Stewart informed the world last week that the media pundits at CNBC failed to provide accurate information about the impending financial crisis. But by using technical analysis, I warned my readers last June what the charts were telling me and transferred my pension money out of mutual funds to money market funds:
“Look at this weekly chart of Bank of America (red line= 30week average; click on chart to enlarge). Other bank stocks with similar charts include : WB, UBS, STI, and DB. When major bank stocks are in a free-fall, can the rest of the market be far behind?” (Posted on June 8, 2008)
The media pundits and the financial advisers are self-serving when they try to convince us that we need their wise counsel. I say that one can rely on the market itself to alert us to danger. I use the TC2007 charting program to analyze the market trend and post my conclusions on this blog. I know a lot of you have used my blog to protect yourselves….
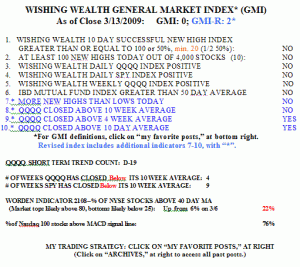
Meanwhile, The GMI remains at zero, and the GMI-R is at 2.  There were only 10 new highs and 24 new lows in my universe of 4,000 stocks on Friday. 76% of the Nasdaq 100 stocks have their MACD above their signal lines, a sign of technical strength. While the QQQQ completed the 19th day of its short term down-trend on Friday, it is getting close to the point when the short term trend could turn up. The key, however, is to wait for the signal and not to jump the gun. It could just as easily bounce down, off of resistance. It will take a little longer to see if this rally is more than a bear market bounce.
Among the stocks hitting a new high on Friday that are on my IBD100 lists from the past year are: AZO, SGP, TNDM and HMSY. AZO and HMSY are near their all-time highs. Stocks at all-time highs can really soar, given that there are no persons who bought at higher levels, incurred losses, and are now trying to sell out…
Maybe when someone so mainstream as Jon Stewart finally gets on the case, it’s a contrary indicator? If you count last week, then yes, auspicious timing.
Hindsight is nice! I remember your comments on TSYS “needle on a haystack, cup and handle, etc” that’s gone nowhere yet. No one is right all the time, only sometimes. I’ve been itching to get back on the market for 3 weeks, but will wait a little longer to see if your indicators have merit. Could we be missing the boat?!
Dr. Wish, recently you stated “When T2108 is below 10, we can look for a rally because the market is oversold.” However, it has been above 12 and up to 22 now, and we’ve had rallies for 4 consecutive days!! It doesn’t make sense. Did you mean the opposite, when it’s ABOVE 10?. Please explain.
The T2108 is like a rubber band. When it is very low, the market is pulled very far down and tight and until it snaps back. Thus, one expects the market to rally long after the T2108 recovers to neutral territory. T2108 is a measure of an oversold or overbought market.