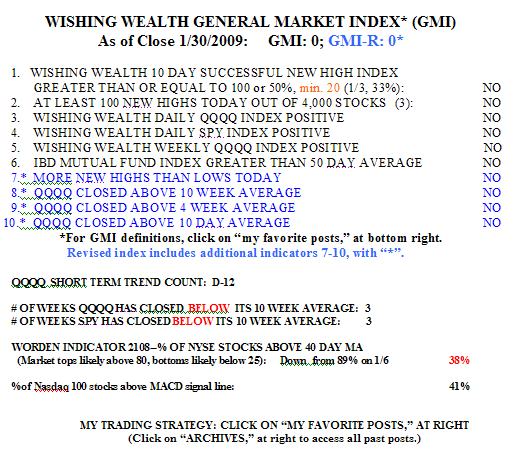
All of my indicators have turned negative again and I am back to cash. I have considered buying some QID, but with my short term moving averages being flat, I will probably get repeatedly whipsawed as the indexes move above and below their averages. However, at some point a real tradable trend will develop. There were 3 new highs and 138 new lows in my universe of 4,000 stocks on Friday. Only 30% of the Nasdaq 100 stocks closed above their 30 day averages and the QQQQ just completed the 12th day of its short term down-trend.
One of the GMI’s components tracks the percentage of “successful” stocks that hit a new high 10 days ago that closed higher today than they closed 10 days ago. It is a useful indicator to see if break-out stocks are continuing to advance. This indicator has been negative since late October, largely because we rarely saw the required 20 new highs in a day. You can see this indicator is still negative in the GMI table below….
I also calculate a similar indicator for “successful” new lows, which I do not post–stocks that hit a new low 10 days ago and then closed lower today than they did 10 days ago.  Well, that indicator has been above 70% for the past four days, indicating that shorting stocks at new lows 2 weeks ago was likely to have been profitable. Clearly, this market has been inhospitable to the strategy of buying growth stocks breaking to new highs. In fact, only 16 (16%) of the stocks on the IBD100 list published on Monday, January 5th, closed higher on Friday than they did on January 2nd. Among the best performers were ESI, NVEC, NFLX , NITE and OTEX –all up at least 14%. The Worden T2108 indicator is at 38%, which is in neutral territory. A reading below 25% is where markets in the past have tended to bounce. But this bear has bounced at much lower readings, sometimes below 10%.
Meanwhile, there are a few things working on the long side, for those wishing to fight the market trend. Gold looks technically strong (ETF: GLD), as does NFLX, which is riding its new service for instant downloads of movies. My son tells me that his fellow college students are using this service. A close by NFLX above $40 could signal a major move up. Nevertheless, I remain mainly in cash. Oh, for the good ol’ days when the GMI was at 6–for months!
The Wishing Wealth General Market Index is unreadable. Perhaps the point size of the type is too small.
The Wishing Wealth General Market Index is too small on BLOG and Email….also in email we used to be able to double click on it and open it up…in a separate Browswer Window…to get a larger view while reading the Post.
Thanks