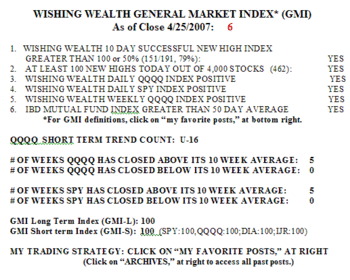
The GMI remains at the maximum of 6.  All indexes in this table are in up-trends. According to the Worden indicator, 80.21% of all stocks closed above their 40 day averages. Market tops have tended to occur in the 82-83% area. Should we sell in May and go away?
See prior post for my disclaimers.
Worden Indicator –
I have used the momentum figures on barchart.com as a similar tool . # of stocks above 200,150,100,50,20 dma , listed daily .
I have noticed coming out of the last correction in mid July 06 that the 200dma has maintained strength and is leading the other moving averages . I have not seen this before. (underlying strength ?)
The lower moving averages on barcharts ind are always more volatile than the 150 and 200 . Good for short term predictions , imho .
Hey Dr. Wish, I was wondering what’s stopping everyone from making lots of money shorting a stock that’s going to be delisted in a few days like DALRQ (Delta Airlines)? It seems like free money to me.