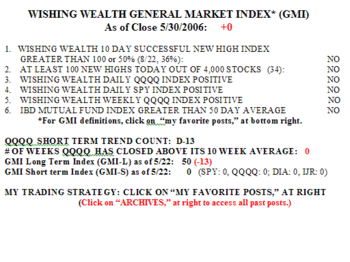
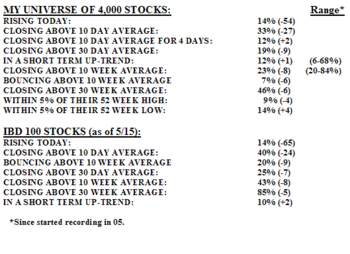
The GMI remains at zero and now my longer term indicators are declining. Weakness in the IJR and SPY indicators reduced the GMI-L to 50; only one half of my longer term indicators remain positive.  On Tuesday, none of the Dow 30 stocks advanced, but 9% of the S&P 500 stocks did along with 10% of the Nasdaq 100 stocks. My universe of 4,000 stocks and the IBD 100 stocks each did a little better, with 14% gaining. There were 8/22 successful 10 day new highs but 73/116 successful 10 day new lows. Shorting and holding new lows 10 days ago was much more likely to be profitable than buying and holding new highs. There were 34 new highs and 60 new lows on Tuesday. Tuesday was the thirteenth day (D-13) in the current short term down trend in the QQQQ.
Almost all my indicators for my universe of stocks and the IBD 100 stocks declined. However, stocks in a short term up trend increased 1-2% for each set of stocks. ….
I remain in cash or in puts in my IRA. I go with the trend and only reverse after the trend has. In a short time we should probably understand what economic events the market has been anticipating.
Please send your comments to: silentknight@wishingwealthblog.com.