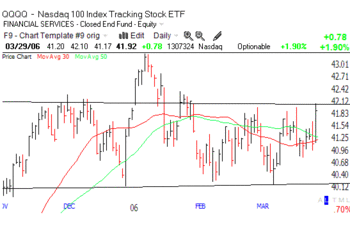
I’m back after a vacation. Well, it was more than a vacation. I have been burnt out on this market. Nothing I have done worked and my account has gone nowhere. The March IBD meetup had only four persons, including myself. All of us were complaining about the difficulty we are having trying to trade this market. And then I had an epiphany. I realized that moving averages are useless for providing signals in a trendless market. Take a look at this chart of the QQQQ.  It is clear to me that, except for the false breakout in January, the QQQQ has been in a flat channel. This index has gone nowhere since last November. Why should we expect to have made any money trading tech stocks in this period? Notice that during this time the index has gone back and forth over the 30 day (red) and 50 day (green) moving averages. Thus, the averages and the GMI have been giving erratic, contradictory signals. The QQQQ had a nice rise on Wednesday but I will believe this rally is for real only if the index closes above the upper channel line (around 42.10) on higher volume soon. If it bounces off the line, I will expect a decline back to the area around 40.19.
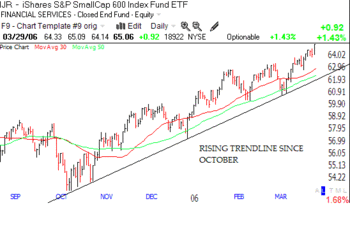
I have a renewed sense of respect for the value of trend lines. Look at the nice up trend in the IJR small cap index.  This index has been rising since early October. In contrast to the QQQQ stocks, traders in small cap stocks probably made money in this period. Why do trend lines work? I guess because so many people think they work. Why should I care to understand the reasons, so long as the lines help me to predict probable levels of support and resistance.
The GMI remains at +6. There were 231 successful 10 day new highs (stocks that hit a new high 10 days ago and closed higher Wednesday than they did 10 days earlier) in my universe of 4,000 stocks.  There were 373 new 52 week highs and only 16 new lows. 86% of the Nasdaq 100 stocks rose, along with 78% of the S&P 500 stocks and 77% of the Dow 30 stocks. More than one half (51%) of stocks are in a short term up trend and 65% are in a longer term up trend. The GMI-L (longer term) remains at the maximum reading of 100. The GMI-S is at 75. The QQQQ and IJR appear to be stronger than the DIA and SPY indexes. 39% of all stocks are within 5% of a new high. It looks to me like the forgotten tech stocks may be about to join the bulls’ party……
Gert: Please get well soon; we miss you.
Please send your comments to: silentknight@wishingwealthblog.com.
Related


Sometimes separation from the markets allows a clearer picture and better analysis of the situation at hand. As the old cliche says, “the trend is your friend.”