This could be the most important week technically for the market since the QQQQ bottomed on August 29. The primary indexes as measured by the DIA, QQQQ and SPY all tell me the same technical story. But first I will review the GMI and WPM indicators. 
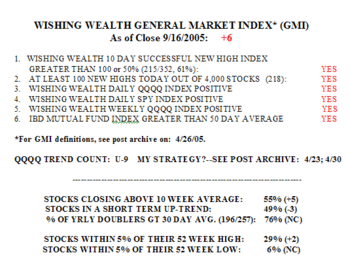
The GMI has registered+6 since September 6, and Friday marks the ninth day in this QQQQ up-trend. There were 218 new yearly highs on Friday in my universe of 4,000 stocks. 61% (215/352) of the stocks that hit a new high 10 days ago closed higher Friday than they closed 10 days earlier. Thus, traders buying new highs 10 days ago and holding on, had a better than even chance of having a profit by Friday’s close. This is a bulllish sign because when stocks at new highs begin to falter, the market tends to weaken. Another sign of strength in the leaders is that about three quarters (76%) of the stocks that doubled in the past year closed above their 30 day averages. This strength in the leaders does not extend to most stocks. Only slightly more than one half (55%) of the 4,000 stocks in my universe closed above their 10 week averages, and about one half (49%) remain in a short term up-trend. Nevertheless, more stocks are within 5% of their yearly highs (29%) than their yearly lows (6%).
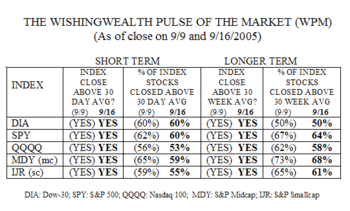
The WPM reveals no meaningful changes in the market internals since last weekend.  All 5 indexes remain above their short term (30 day) and longer term (30 week) moving averages. Similarly, 50% or more of all of their component stocks remain above these averages. The largest changes (declines) occurred within the midcap stock ETF (MDY).
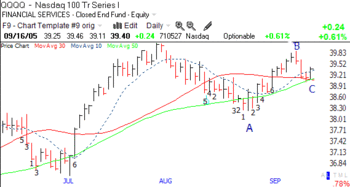
So what is going in here? As I read it, the up-trend is still intact in all of these markets. However, the indexes came very close to violating their short term averages this week. This QQQQ chart is almost identical to that of the SPY and DIA. (The numbers in black show the changes in the GMI over time, click on to enlarge.)  Note that the QQQQ bottomed in late August (point A) and then started a rise that topped out on Tuesday (B). On Thursday and Friday the QQQQ bounced off of the flat 30 day (red line) and rising 50 day (green line) moving averages (C), which have converegd. The fact that these two averages are almost identical means that the market has basically not changed over these 2 periods (the average of the closes over the past 30 days is the same as the average over the past 50 days). This is especially important because, similar to the behavior of Bollinger Bands, when the averages converge on each other, it often means that a significant move will occur once a direction is taken. It is almost like a compressed spring, which expands quickly when released. The fact that the 10 day average (dotted line) is above the other 2 averages is bullish. The critical signal for me is whether the QQQQ closes and remains above or below its 30 day average this week. A close above point B on increased volume would be very bullish. Remember, the technical pattern I have described is identical for the DIA and SPY. The direction of the entire market may be at stake………………………….
The safest strategy for now is for me to hold a watchlist of stocks to buy or sell after a definitive signal is given for the general market trend. Remember, most stocks go with the market trend and it is therefore safer to trade with the trend. I have run scans for weak and strong stocks. Among the short candidates I am watching are: WYNN, TECD, CCL, WON, NEW , DECK, YHOO. (Yes, even Yahoo looks sick to me now.) Long candidates include: AAPL, SMTS, KEYW and UPL. Of course, I will only make these transactions after researching them more and I always place a suitable stop loss.
Please send me your feedback at: silentknight@wishingwealthblog.com.
Although I think the odds are good the market will move down the 19th, I’d lean more toward the strong stocks.
Additional long candidate: GG
Good luck to all the FOMC whisperers.