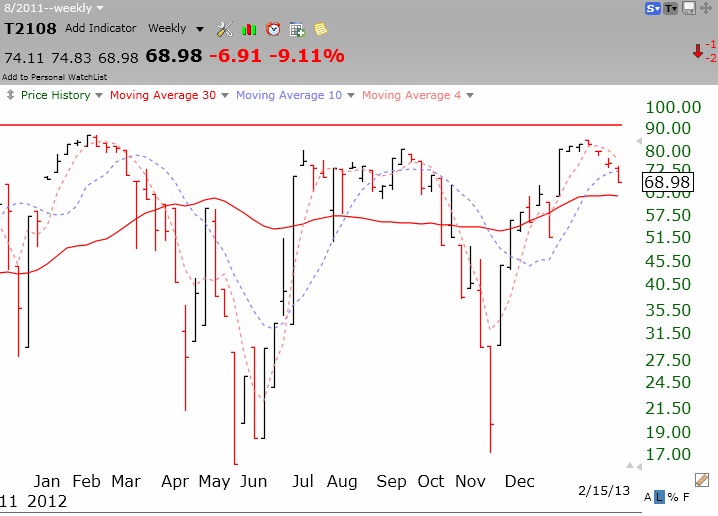
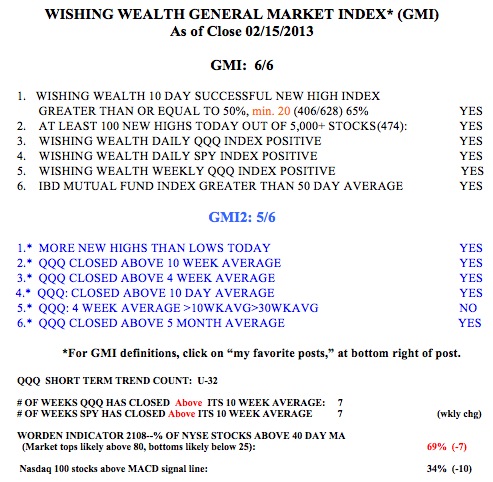
Although the GMI (General Market Index) remains at 6 (of 6) and on a buy signal, the Worden T2108 daily chart below looks like it is weakening and may be showing that NYSE stocks are starting to decline. T2108 shows that only 69% of the NYSE stocks are now above their average close over the past 40 days. In addition, only 34% of the Nasdaq 100 stocks closed with their MACD above its signal line, another sign of short term weakness. With more antics to be expected out of Washington the next two weeks, we may finally see some reaction to the sequester debacle in the market averages. So, I am getting quite cautious.
Hi, thank you for all the insightful posts. What actions do you take when you become quite cautious? Thanks.
Raise stops and cash.
T2108 popped right back up. I am curious why the direction of T2108 on a given day matters more than say, its overall level? Do you have specific rules around interpreting T2108 within context?
Dr. Duru
I look for divergence on T2108 and indexes. For Example, As SP-500 making a new high the T2108 makes low which is happening now. You can check it on Tc2000 by clicking on price and comparisons and add t2108 which will show both price and t2108.