Everyone wants to know if the bottom of this bear market is finally in place. The truth is that only liars and lucky people can really call a bear market bottom close to its occurrence. I noticed years ago that the pundits on TV usually felt comfortable calling a new bull market about six months after the actual bottom.
The true trend follower rides the current trend until his/her indicators suggest a new trend has begun. But all trends are not equal. Within a longer term down-trend there are short term up-trends. Currently, we have had a daily up-trend within a weekly and monthly down-trend. Day traders who monitor trends by the minute or hourly, for example, can trade numerous up and down trends within the longer term trend.
Thus, each person needs to determine his trading time interval when trying to trade trends. And one can trade different pots of money using different time trends. So I will not commit my university pension money to the long side of the market when the weekly trend is down. I stay in cash during such periods. But I may trade with my IRA funds during a daily up-trend that is occurring withing a weekly down-trend. However, I have had more success trading consistent with the weekly trend and tend to stay mainly in cash even in my IRA during a weekly down-trend. It is hard to resist buying some recovering stocks during a rally like we have just had, even though my longer term trends are still down.
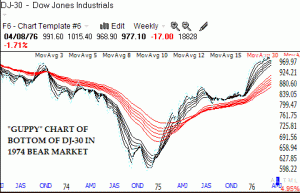
 Thus, while the short term daily trends of the Dow have turned up, the weekly trends remain down. I ran some “Guppy” weekly charts of the Dow and they do not yet look like they did at prior bear market bottoms. Guppy charts were invented by Daryl Guppy, whose book is listed to the lower right. These charts show a series of 12 short term and long term moving averages. The important thing to know is that in an up-trend, the short term averages (black here) should be climbing above the longer term averages (red). The first chart shows the bottom of the Dow 30 after the 1974 bear market, a decline that was similar in scope to the current decline. Note how the long term averages were all below the short term averages for most of the decline and then reversed and climbed above them for the subsequent bull market. Similar patterns have occurred at all of the prior bear market bottoms.
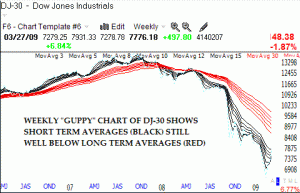
 Now look at a Guppy chart of the current Dow. We are a long way from having the short term averages turn up and rise above the longer term averages. So, for me this market remains in a longer term down-trend. Some people can gamble by throwing their money back into the market immediately. I prefer to wait until an up-trend is in place. Contrary to the pundits, there is plenty of time for me to commit my university pension money back into the long side of the market once a solid new up-trend has begun. The key to success in investing is to lose as little money as possible during the inevitable market declines that occur. I will wait until these black lines are above the red lines.
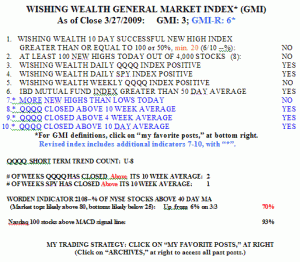
Meanwhile, the GMI, which includes some longer term indicators, is still not very strong.  The GMI is at 3 (of 6) and the more short term sensitive GMI-R is at 6 (of 10). At a time when few stocks hit new 52 week highs, it is not time for me to invest too heavily in growth stocks at new highs. Friday was the 8th day (U-8) of the current QQQQ short term up-trend. It is noteworthy that the Worden T2108 indicator is at 70%, down from 75% on Thursday, very close to over bought territory where prior rallies have topped out. Both the QQQQ and SPY ETF’s are now above their 10 week averages, a sign of short term strength. And 93% of the Nasdaq 100 stocks had a daily MACD close above its signal line, another show of short term strength.
So, I remain mainly in cash with a few small long positions during what appears to be, for now, a short term rally within a longer term down-trend. I will wait quite a while for more confirmation of a longer term up-trend before I commit more of my hard earned money.
Dr. Wish, even though you remained mainly in cash, you did lose some money in several of those “small positions” you’ve held off and on since January. I kept track of those you stated “I own some of these”. And given your usual 7% stop loss, you must have been stopped out of several of those small positions because they retreated below the 7% level, TSYS is one example even though it climbed up again. However, you never say that you lost money on those “small positions”! Let it be known that it’s OK to admit occasional loss because not even the best investor wins consistently all the time. You’d be more credible if sometimes you tell people that you lose, too!
Of course I have lost money trading the past year, but I have beat the averages by far. I was down about 5-6% last year. I do not wait for a 7% loss to get out and often hedge with a covered call position.
Like your Guppy charts. Maybe you would consider putting them on for the SP500 and QQQQ on a regular basis. Maybe once or twice a month.
Thanks