Back from Mark Minervini’s Wonderful Master Trader Program

GMI2/6
GMI-28/9
T210838%

img_0708

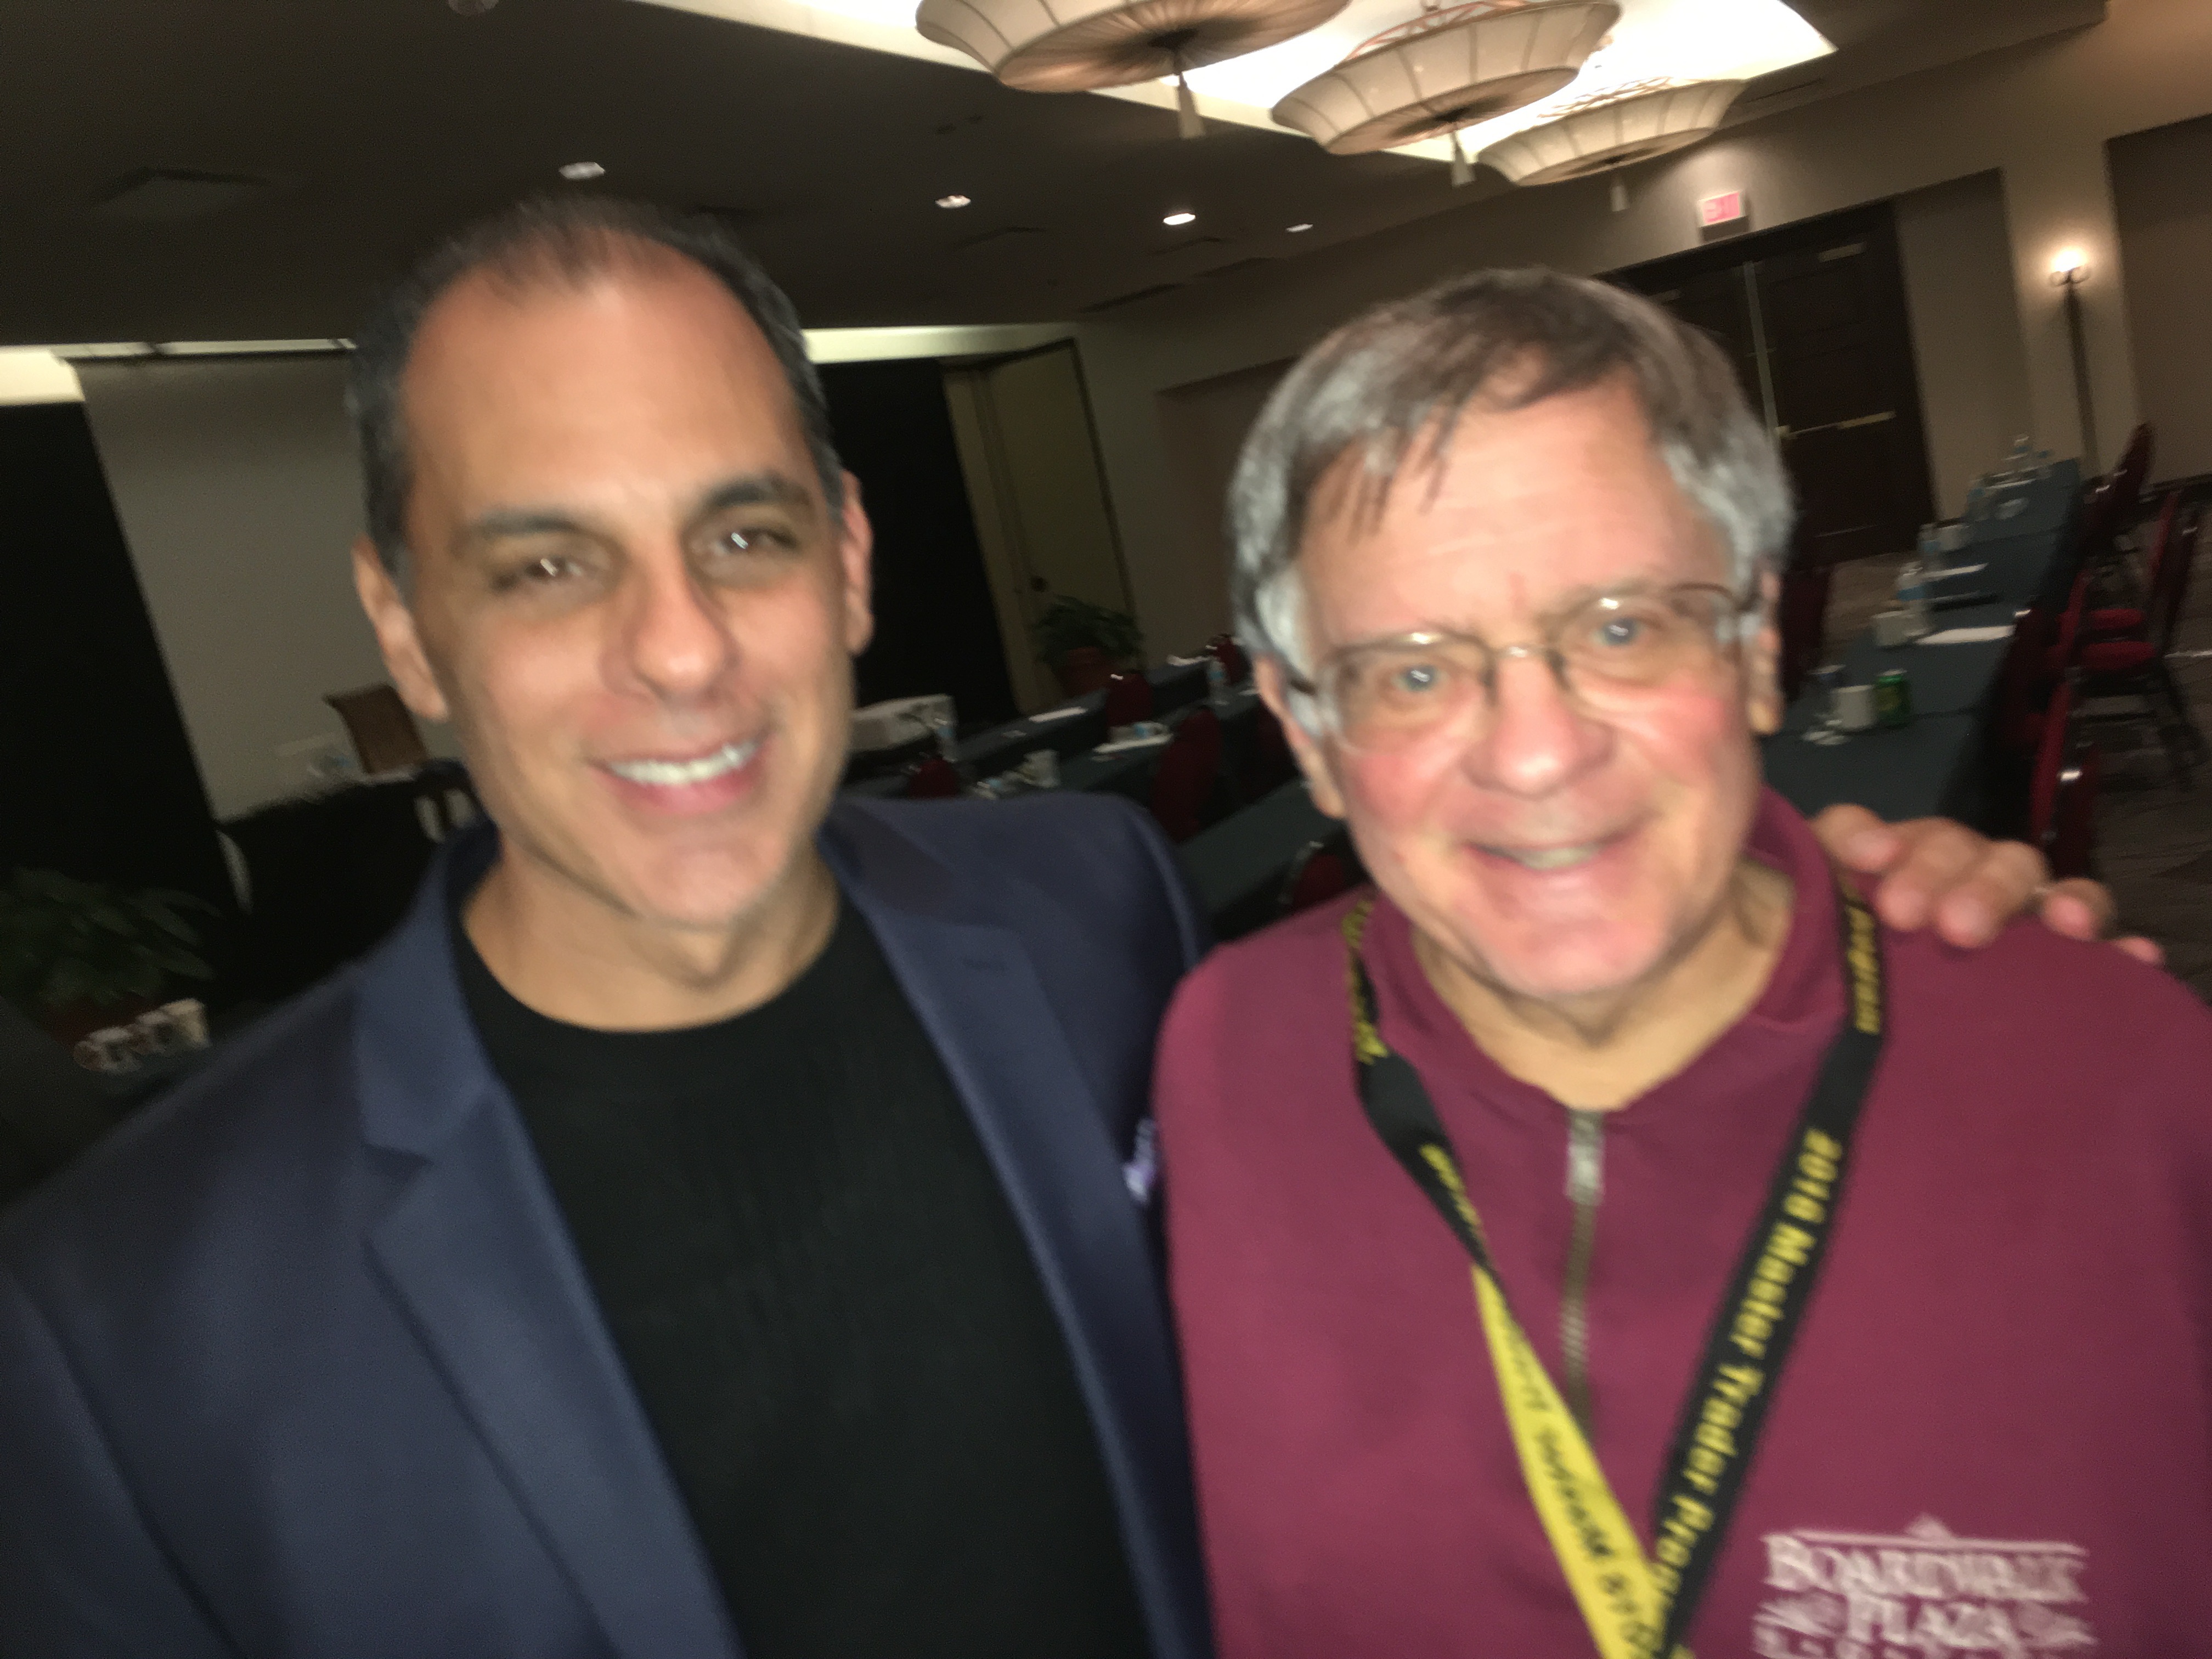
I just spent 3 days in Myrtle Beach, South Carolina, at an intensive 3 day workshop for committed stock traders. It was a privilege to spend time with two of the greatest stock traders, Mark Minervini (above) and David Ryan. They taught the attendees what they had learned as they amassed their fortunes in the market. I had read Mark’s book, listed to the right, and was impressed with his trading strategy that draws upon stage analysis and his own brand of stock trading. I had also admired the writings of David Ryan, William O’Neil’s protege, and require all of my students to read his wonderful chapter in Market Wizards.

While I was expecting to learn a lot from these masters, I was not prepared for the compassionate and decent human beings that these two men are. They greeted me and immediately offered to present a lecture (by Skype) to my students. They both are dedicated to educating young people in financial literacy and in how to manage risk in the stock market. And if that wasn’t enough, I was amazed to see how many of the traders came up to me and thanked me for teaching technical analysis to students at a university. The personal qualities of the attendees was far beyond anything I had expected and created a warm and receptive environment for the workshop. As I left the workshop, Mark reiterated that he wanted to begin teaching my students as soon as possible–wow!

The first two days (Saturday and Sunday) we spent almost 12 hours each day listening to Mark and David. We could have been just as easily in a desert rather than a beautiful and fully supportive resort hotel. All were totally focused on the information being presented. They showed over 600 slides that taught everything from how to select stocks, the price patterns that are most profitable, the way to set stops, pyramid up, and close out positions. They gave the best information on the value of cutting losses that I have ever seen. I also got a real feel for the benefits of using IBD’s MarketSmith service. (And no, Mark did not even once try to take advantage of the opportunity to sell any of his other trading books or services–what integrity!) Mark would not leave the training room until people had an opportunity to ask every question they had. I have never witnessed in a prestigious speaker such devotion to educating and serving every attendee.

The third day (Monday) was a newly added feature. We watched Mark and David prepare for the market open, and then observed them and Mark’s associate, Bob Weissman, actually place trades. This experience gave me a unique insight into what it really takes to trade stocks profitably as a business. Monday evening ended the long day with Tony Robbin’s son, Jairek Robbins, conducting a 3-hour session on how to enhance one’s psychology and well being to enable one to handle the stresses and requirements of trading. This was also an invaluable experience. That session ended around 10:00 PM!

I found that Mark has put together a program to enable people to ready themselves for trading successfully. He has put into a 3 day session much of what it took me over 50 years to learn. I may even attend again next year, as many of the other attendees were doing. I am now eager to infuse my curriculum with the new insights I gained and look forward to the day when Mark and David will present a lecture directly to my students. Thank you to Mark, Bob and David and to the attendees, my new stock buddies.

Major indexes remain in longer term down-trends; in cash or short

GMI2/6
GMI-R4/10
T210846%

For those of you who are first time readers, welcome!   I want you to know that I write this blog to share my experiences gained from trading over more than 40 years. I also write this blog to educate my students at the University of Maryland, who are enrolled in my classes on technical analysis of stocks.   I am passionately committed to educating people about trading because I believe that our education system has failed to prepare its citizens for their financial survival.   My students learn to greet assertions and   advice from the pundits in the financial media with a heavy dose of skepticism and their own critical analysis.

As a part-time trader, I have educated   myself through extensive reading of the works of successful traders and through analysis of my own trading performance.   I bring my training as a research psychologist to the subject of trading. I have been able to multiply my IRA 14x since 1995 and have been able to keep my university pension safely in cash during all of the major market declines since 1998, and to reinvest the funds in the subsequent advances. My university pension has been spared the scars and heavy losses from the declines in 2000-2002 and 2008.

I rely heavily upon my General Market Index (GMI) to keep me on the same side as the major market trend.   The GMI is a simple count of the six indicators that I use to gauge the market’s short and longer term   trends. I exit to cash when my indicators signal a major down-trend, usually when the GMI is below 3. I wade back into the market slowly when the GMI recovers. I do not predict the length of trends, I try only to ride them until they end. The few excellent books that made a difference to my trading are posted to the lower right of this blog, and most are required reading before my students are allowed to formulate trading rules and test them in a virtual trading exercise.   I compose each daily post after the market close, and publish it on Monday through Friday around 7:00 AM EST. While I publish the GMI reading every post, I present the GMI’s full components only on   Monday morning. I hope that readers will benefit from my experiences and apply whatever they find useful to their own trading.   I am empowered by your comments and ask that you give me feedback in the comment section of each post, or send them to me via email at:   silentknight@wishingwealthblog.com.

———————————-

One reader chastised me for appearing to depart from my prior recent posts in which I wrote about a weak market. He said that if I began to question the down-trend, then Mr. Market had finally fooled me, and the market would fall.   He was right, the market did decline on Friday, but I think it had little to do with my sentiment about the market.   I have been saying that the longer term trend of the indexes remain down, even as my short term indicator for the QQQQ turned up late last week.   According to my way of identifying the short term trend of the QQQQ (Nasdaq 100 index ETF), the market completed its third day of its new short term up-trend on Friday, which is a counter-trend move within a longer term down-trend.   I have been showing you that the daily 10,4,4 stochastic statistic reached very overbought levels and the market was due for another dip.   It was this overbought condition, and not the reasons posited by the media pundits why the market sold off. So now we have to wait to see whether this dip will go to new lows or hold above them. You can see in this daily chart of the Dow 30   (click on chart to enlarge) that the stochastic at the bottom window (red line) has just curved down.   Whether it will fall to oversold levels again is unknown, but note that all of the recent declines ended with the stochastic well below 50 . We just need to wait for the market to reveal its trend.   I also use the stochastic to time my buys and sells.   For example, I was not looking to take any new short positions while the stochastic was very low. By the way, the other two major index ETF’s   I follow (SPY, QQQQ) show the same pattern as the Dow.

But all of this daily action is occurring within a weekly down-trend.   It is the weekly down-trend that tells me whether to be in cash or in stocks.   As you know, I have moved all of my university pension from mutual funds to money market funds recently.   I could be wrong or perhaps premature in my timing, but my philosophy is to be in the market when we are in an established longer term up-trend and to stay on the sideline safely in cash otherwise.   I was able to remain invested for a long time while the GMI was at 4 or higher. But the GMI has been less than 4 for much of   May and June and every day since June 22nd.   As you can see, the GMI is now at 2? (of 6) and the more sensitive GMI-R (revised) is at 4? (of 10). The “?” indicates one of the indicators is too close to call. In addition, the Worden T2108 Indicator is at 46%, in neutral territory. Prior tops tend to occur when the T2108 is near 80% and bottoms when it is below 20%.   (The T2108 measures the percentage of NYSE stocks that have closed above their simple 40 day moving average of price.)   86% of the Nasdaq 100 stocks have their daily MACD above its signal line, a sign of a short term up-trend. Finally, the QQQ and SPY have closed below their 10 week averages for 11 straight weeks.   I cannot make money trading on the long side when these indexes are below their 10 week averages. More disconcerting is that the 10 week average is now declining below the 30 week average (click on weekly chart of the QQQQ below to enlarge).

So, to sum it up, I remain largely in cash or short.   I will not trade long when the major averages are in longer term down-trends.   When they reverse, there will be plenty of time to get back in during the next major longer term up-trend. Unfortunately, we have all been wrongly taught that we cannot time the market and   should remain in the market all of the time.   The most successful traders in history, exit the market or go short when the trend turns down.

Short term down-trend deepens; QQQQ Guppy chart ominous; In cash

GMI1/6
GMI-R2/10
T210830%

I started teaching two classes on technical analysis last week and will explain more of my concepts and include informational links, as many students will be new readers.   My General Market Index (GMI) keeps me trading with the general market’s trend.   The GMI is a count of 6 short and long term indicators.     Because I like to trade growth stocks, the GMI focuses largely on the NASDAQ 100 stocks, as measured by the ETF, QQQQ.   The Successful New High Index measures whether stocks that hit a new high 10 days ago have risen since that time.   Since I trade stocks at or near new highs, I also like there to be at least 100 new highs in my stock universe of roughly 4,000 actively traded stocks above $5. My daily QQQQ and SPY indicators measure these indexes’ short term trends. The weekly QQQQ indicator is my measure of the longer term trend.   Weekly charts provide me with a more interpretable and reliable picture of the market’s trend.   Finally, my IBD Mutual Fund Index indicator tells me how well growth funds tracked by IBD are doing.   If   funds that invest in growth stocks   are doing well, I am also more likely to make money trading growth stocks. I subsequently added four more   indicators to   the GMI in the form of the GMI-R (revised). The added indicators count whether there are more   daily new highs than lows, and how the QQQQ has performed in relation to three moving averages.   I become very defensive in my trading portfolio when the GMI is less than 4 and consider going to cash.   When the GMI goes to zero, I also start going to cash in my more conservative university pension account, which allows me to trade its contents only a few times each year.   So, with the GMI currently at 1,

Read more