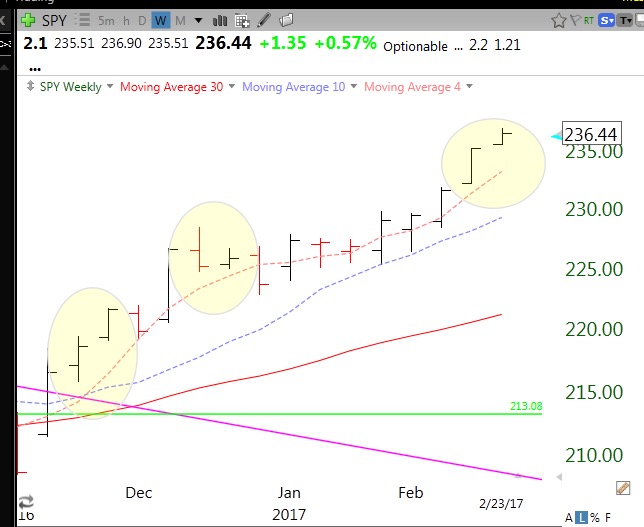
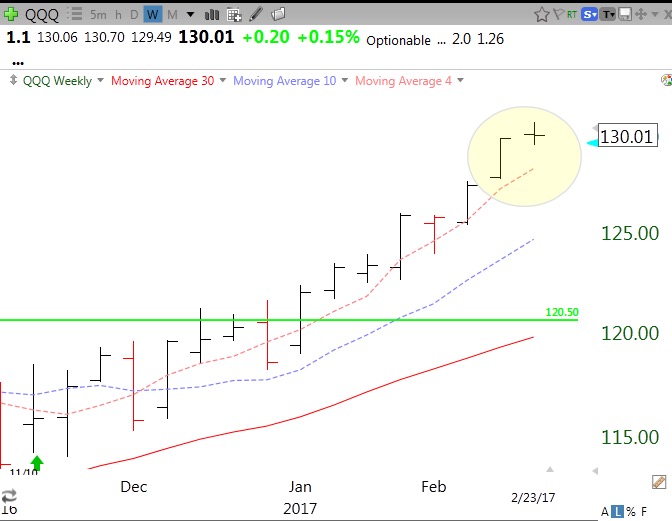
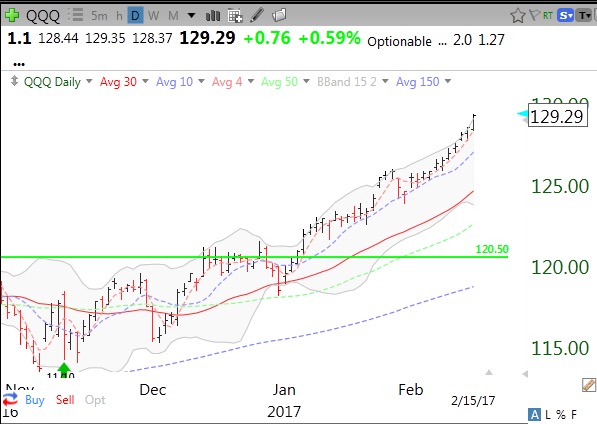
I wanted to examine how the index ETFs have performed since the GMI (my General Market Index) turned green on 11/10/2016. The GMI components mainly measure momentum in the QQQ so its signals should probably work better for nonfinancial growth and tech stocks contained in the NASDAQ 100 index (measured by the QQQ).
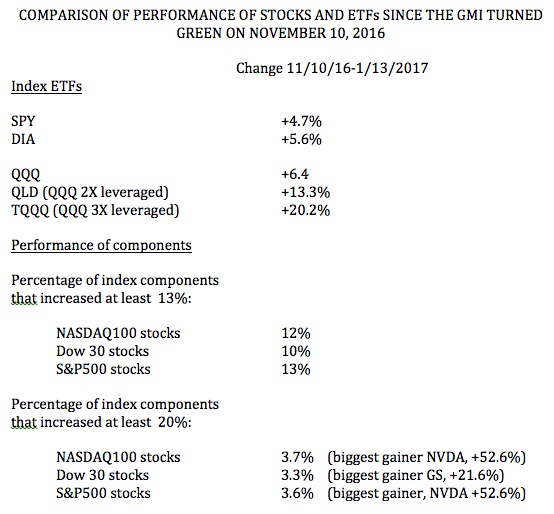
This table shows that between 11/10 and last Friday (1/13) the QQQ rose +6.4%, the SPY +4.7% and the DIA +5.6%. Note also, by definition, the leveraged ETFs for the QQQ rose much more, the QLD rose +13.3% and the TQQQ +20.2%. The really interesting finding in the table is that these leveraged ETF far outperformed most of the individual stocks in these indexes. For example, only 12% of the NASDAQ 100 stocks, 10% of the Dow stocks, and 13% of the S&P500 stocks rose more than 13%. In other words, the QLD did better than 87-90% of the stocks in these indexes. The triple leveraged ETF, TQQQ, beat about 96% of the individual stocks in these three indexes! So I again come to the conclusion that if I can pick in advance the 4% of stocks that can beat the TQQQ, then I should do so. However, for most of us mortals, one only has to ride the TQQQ during an up-trend (GMI=green) to beat the pants off of most individual stocks, and it is so much easier to monitor one index ETF than to manage a portfolio of individual stocks……..(I have been accumulating the TQQQ since the GMI flashed green.)
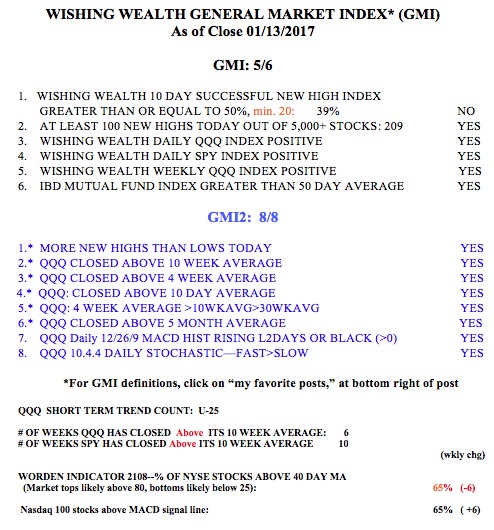
The GMI remains green with 5 (of 6) components positive.