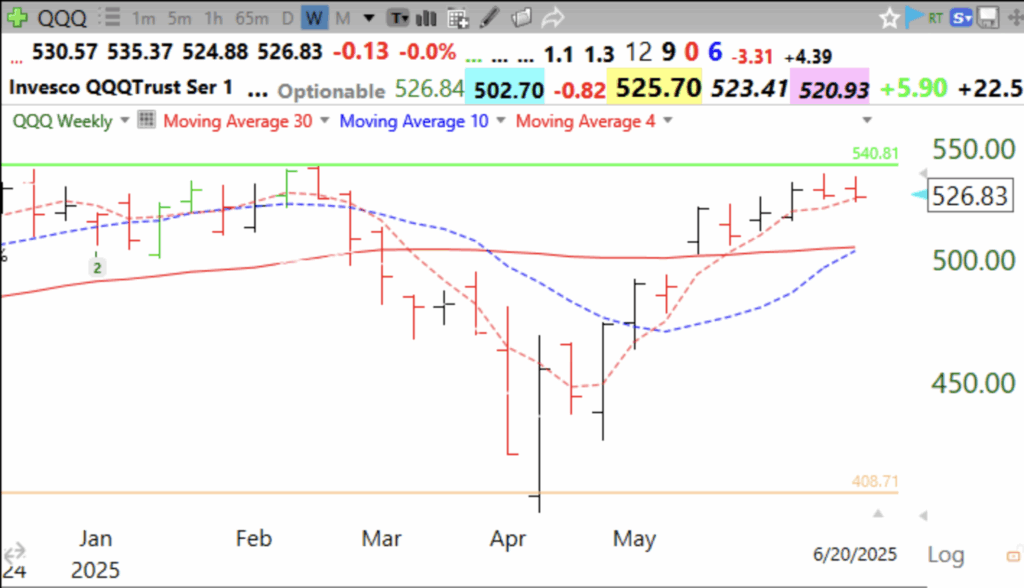
I find that the weekly chart gives me the clearest idea of the trend. QQQ is now just below its green line top and above its rising 4 week average (red dotted line). Will it have a GLB? Rather than predicting the future, I prefer to react to a break-out or break-down, once it has occurred. Note that the 10 week average (blue dotted line) is rising to just below its nearly flat 30 week average (solid red line). Something has to give. We could have a definitive signal this week.
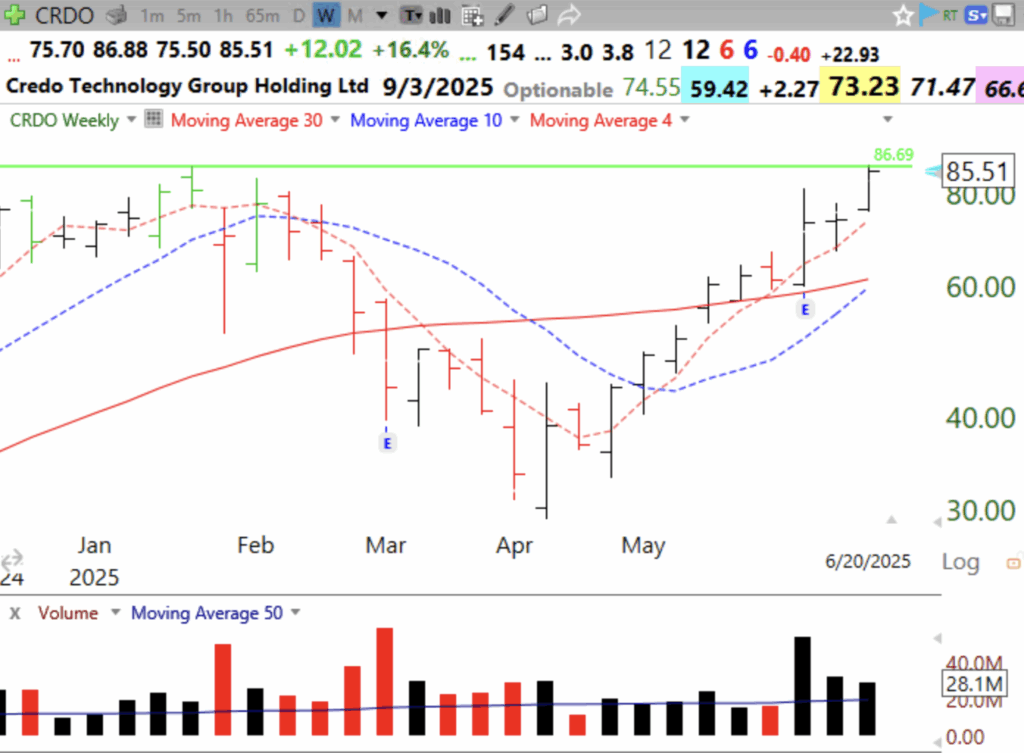
Meanwhile, this weekly chart of CRDO shows it to be just below its green line top. The pattern is similar to the one above for QQQ. This week could bring a green line break-out (GLB) to an ATH (all-time high) for CRDO. Note its high volume rise after its earnings release 3 weeks ago, a promising sign. CRDO has closed the last 9 weeks above its rising 4 week average, a major sign of a rising stock. Remember, if I buy a GLB, I must sell it if it closes any day back below its green line. If it does and I exit, I often buy it back if/when it closes back above its green line.
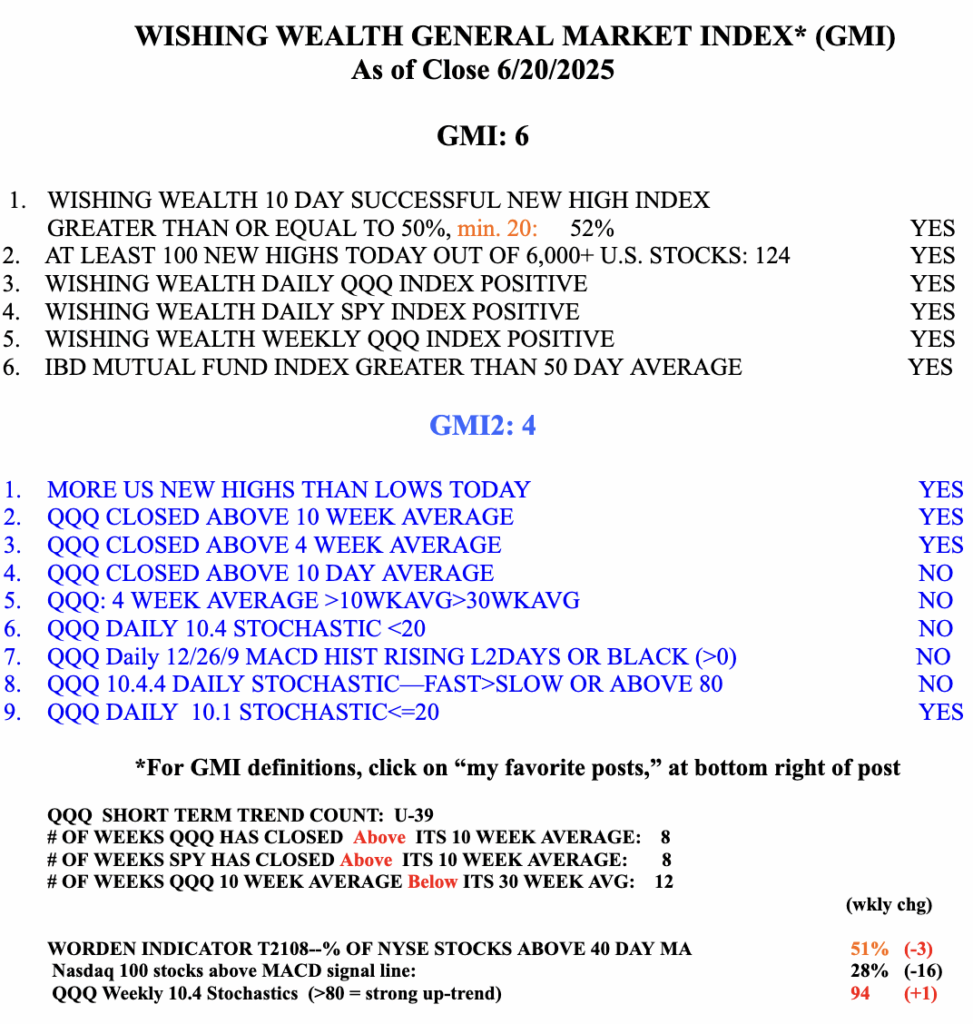
The GMI is Green and registers 6 (of 6).