GMI on verge of turning Green; GLB: $SHAK

GMI4/6
GMI-25/9
T210841%

The markets appear to be strengthening. A solid day on Thursday could also create a new QQQ short term up-trend. A number of stocks look promising. After the excitement of SHAK’s IPO in January, 2015, the stock retreated from a high of 96.75 to a low of 30.12 in September 2017. SHAK has now had a GLB to an all-time high.  This monthly chart shows the pattern. I often buy an IPO that forms a green line top when it eventually breaks above it.

The GLB actually occurred a few days ago, rested,  and the stock took off on Wednesday. I bought some and will sell if the stock closes back below its green line. I tweeted about SHAK intraday on Wednesday. Sign up for my tweets: @wishingwealth

Bounce fails to break above resistance and GMI remains Red ; 22nd day of $QQQ short term down-trend

GMI3/6
GMI-23/9
T210835%

The  future of the longer term up-trend depends on whether the QQQ can find support again at the 150 day moving average (lower purple dotted line). However, the most recent green dot signal is still operative. I am in cash in my trading accounts and waiting for Mr. Market to tip his hand.

An ominous sign is that the daily RWB up-trend has clearly ended. Will it turn into a BWR down-trend?

Schizoid market–GMI moves to 4 but $QQQ is at short term resistance

GMI4/6
GMI-25/9
T210838%

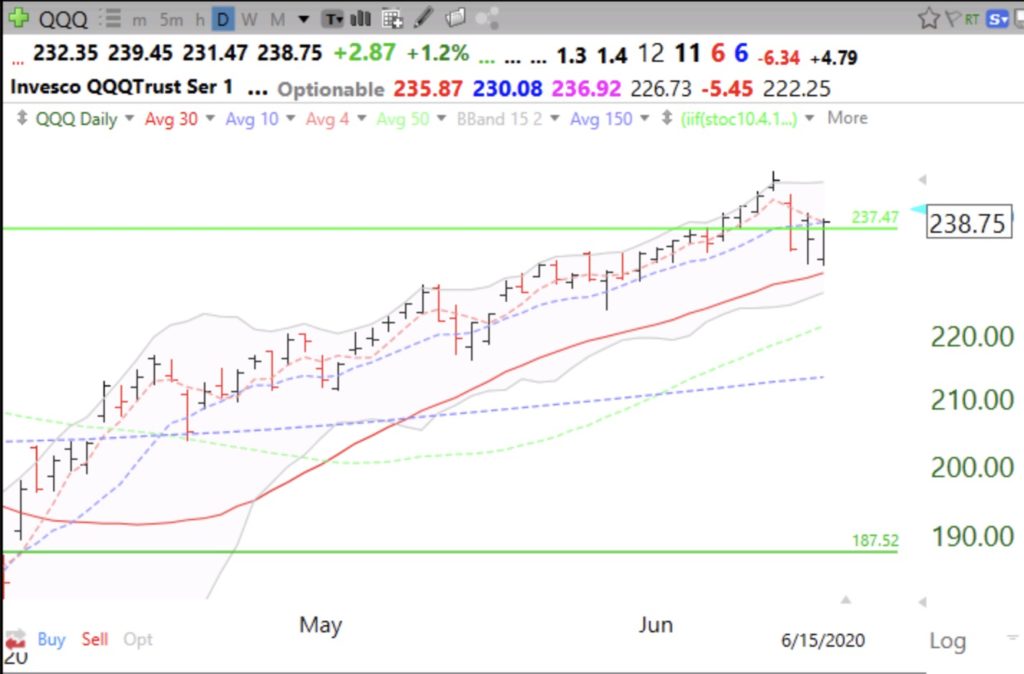
This is a schizoid market. My longer term indicator, the GMI, is at 4 and could turn Green with another day above 3. And the QQQ remains in a longer term Stage II up-trend. But my short term trend indicator for the QQQ is still down and in its 21st day (D-21). On Friday it looked like the QQQ was breaking through resistance, but it closed back below its important 30 day average. With futures down tonight, the indexes may slide at the open. But let’s give it time to discover whether the short term trend is about to close up. Note that September is historically the worst month for the market.

The solid red line is the 30 day moving average. Note Thursday’s green dot signal. A close above the 30 day average would be a bullish signal for me.