Blog post: Day 67 of $QQQ short term up-trend, since 2006 only 7 of 95 up-trends lasted longer
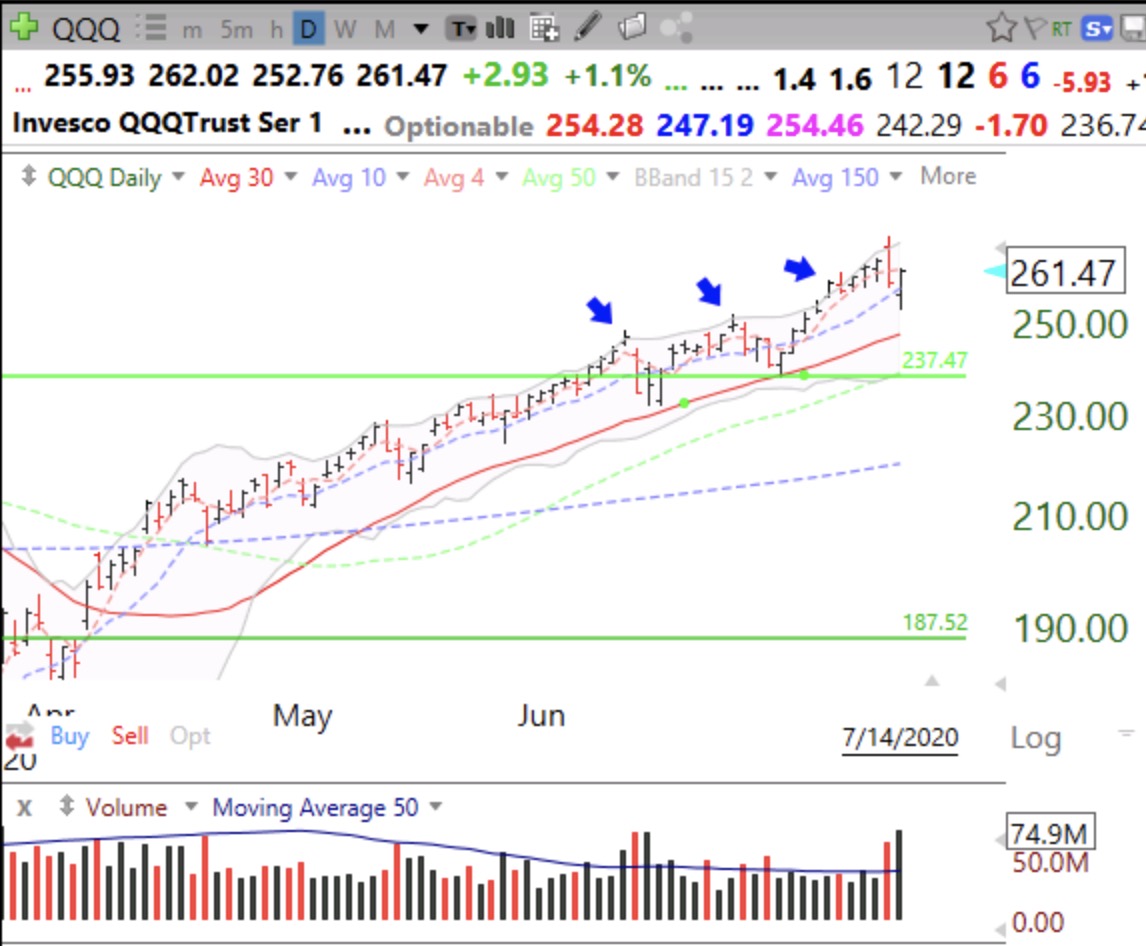
As my readers know, I compute each evening the number of days that the QQQ has been in a short term up-trend or down-trend. (I have a proprietary objective method for designating changes in the short term trend, so don’t ask for it.) Since 2006 there have been 95 short term up-trends. The current up-trend has now reached 67 days. The longest short term up-trend since 2006 lasted 91 days, from October 14, 2019-February 24, 2020. This was followed by a 30 day short term down-trend that included the steep March decline. One of the reasons I became so cautious in February was because the up-trend had gone on for so long. The fact that the current short term up-trend has now reached day 67 leads me to suspect the current up-trend will end soon. The ending of a short term up-trend and the start of a down-trend does not necessarily signify a large market decline. The down-trend could be very short. Nevertheless, I have one foot out the door now. I post the short term trend count, now U-67, in the GMI table each weekend.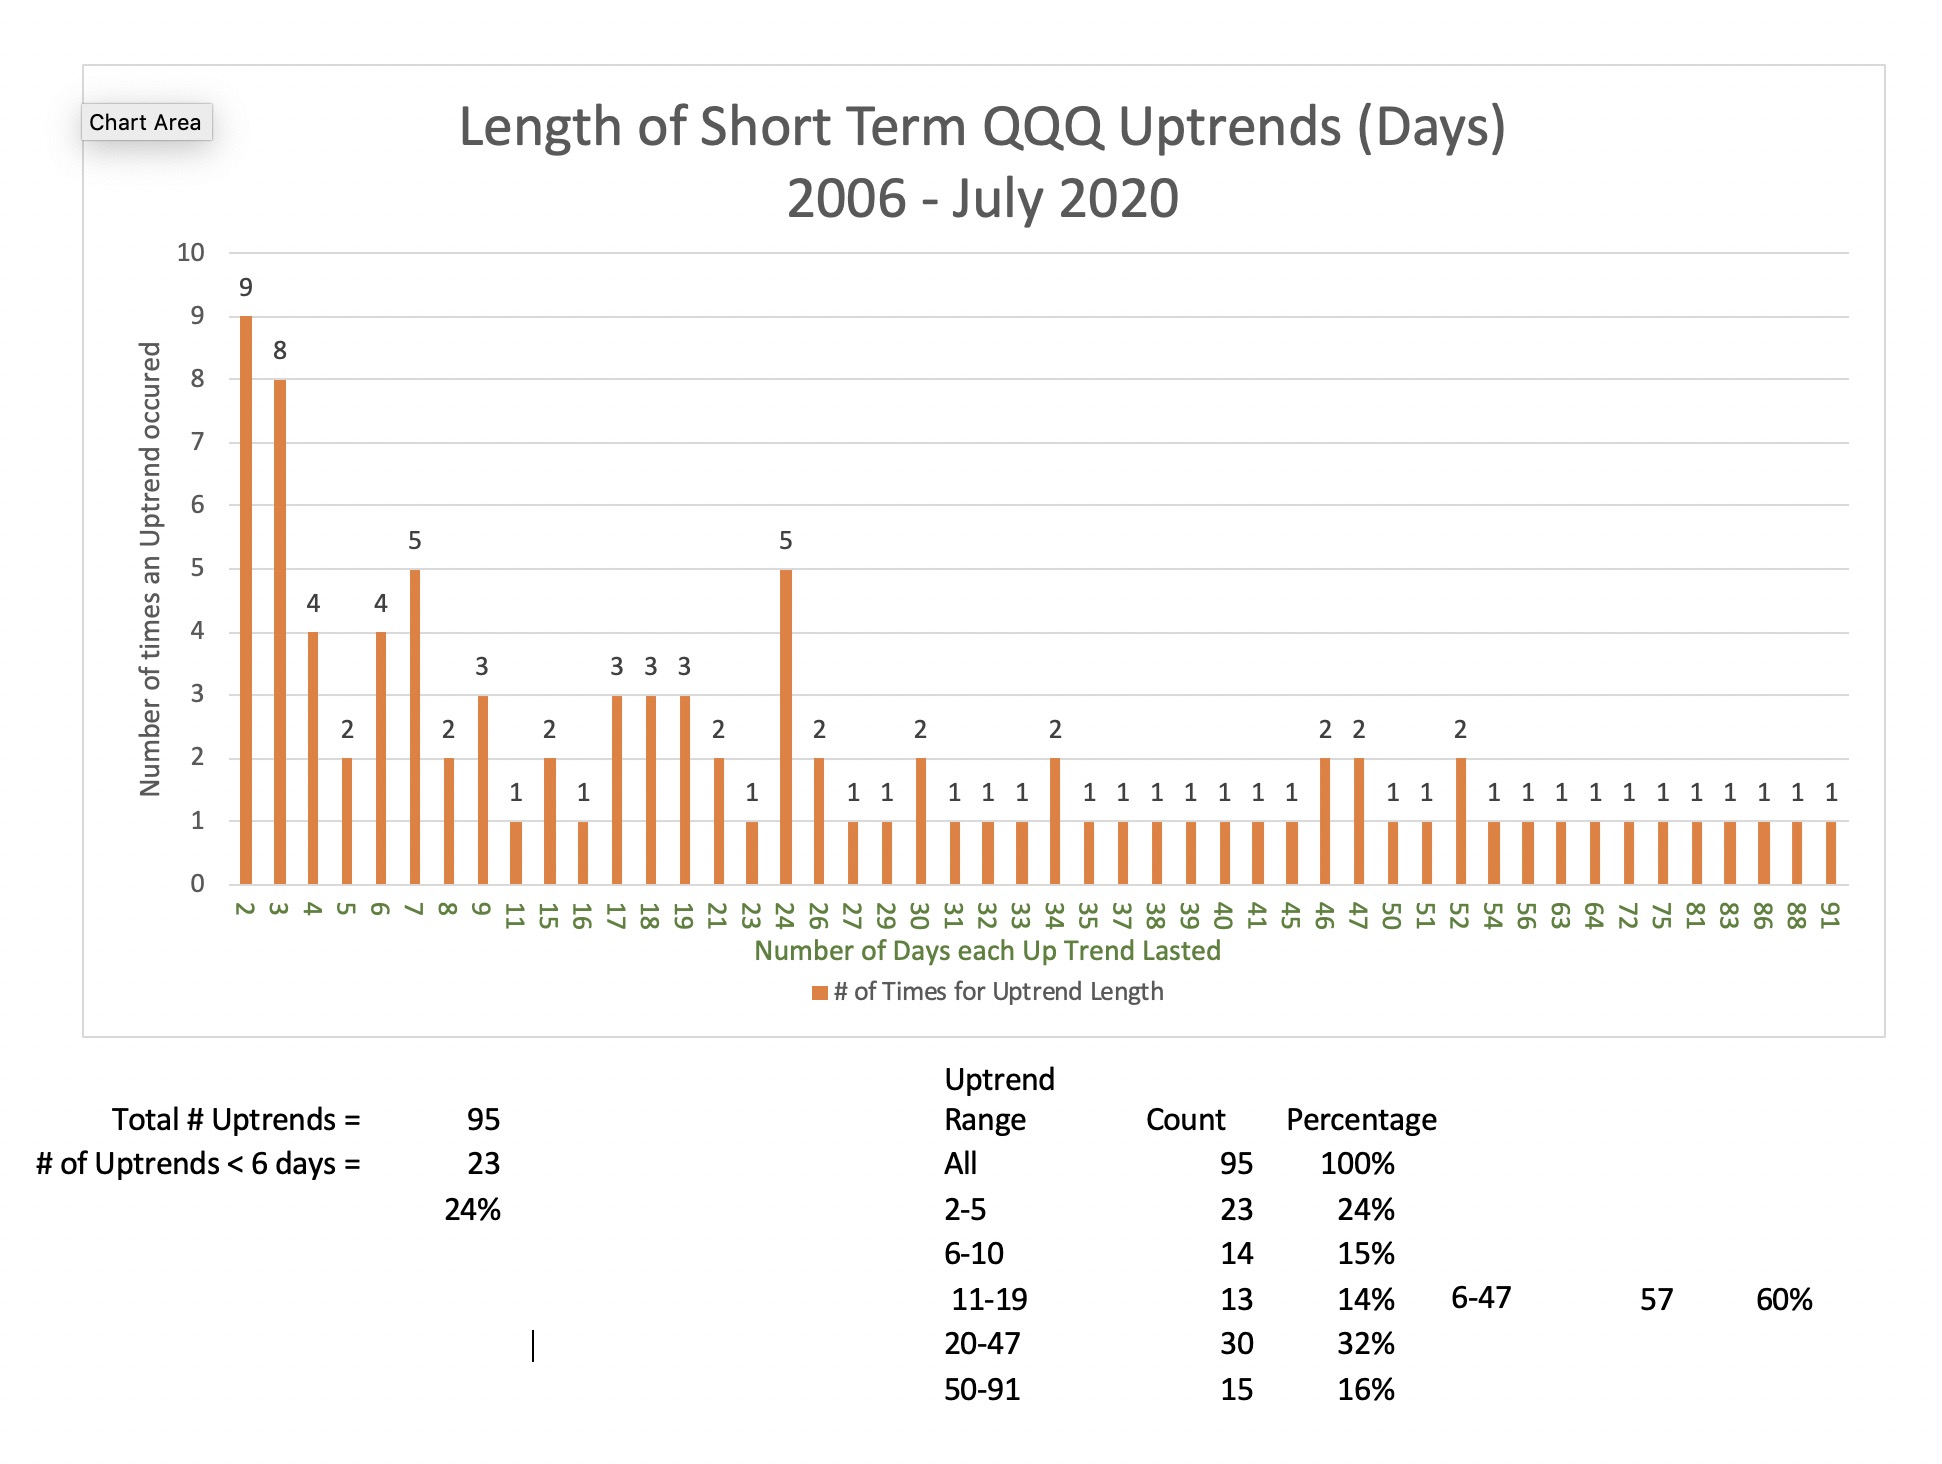
Blog post: $NIO has high volume GLB–will it hold? $VRNS has.
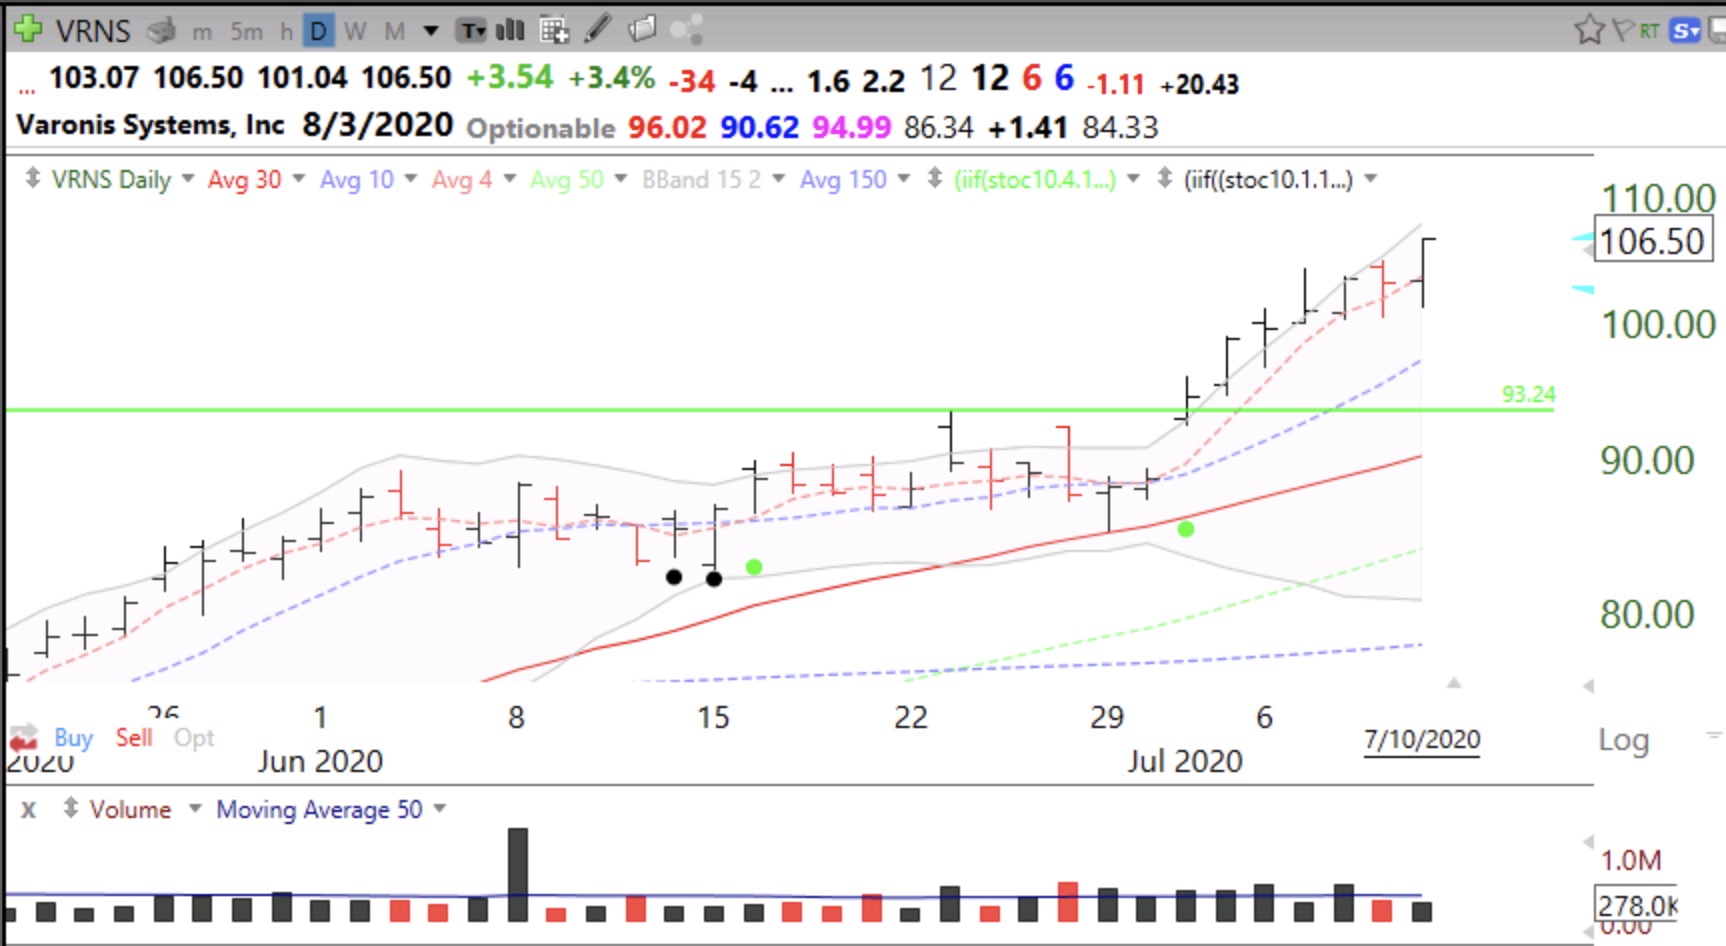
A few days ago I told you when VRNS had a GLB (green line break-out) to an ATH (all-time high). This daily chart shows that VRNS has held nicely since then.
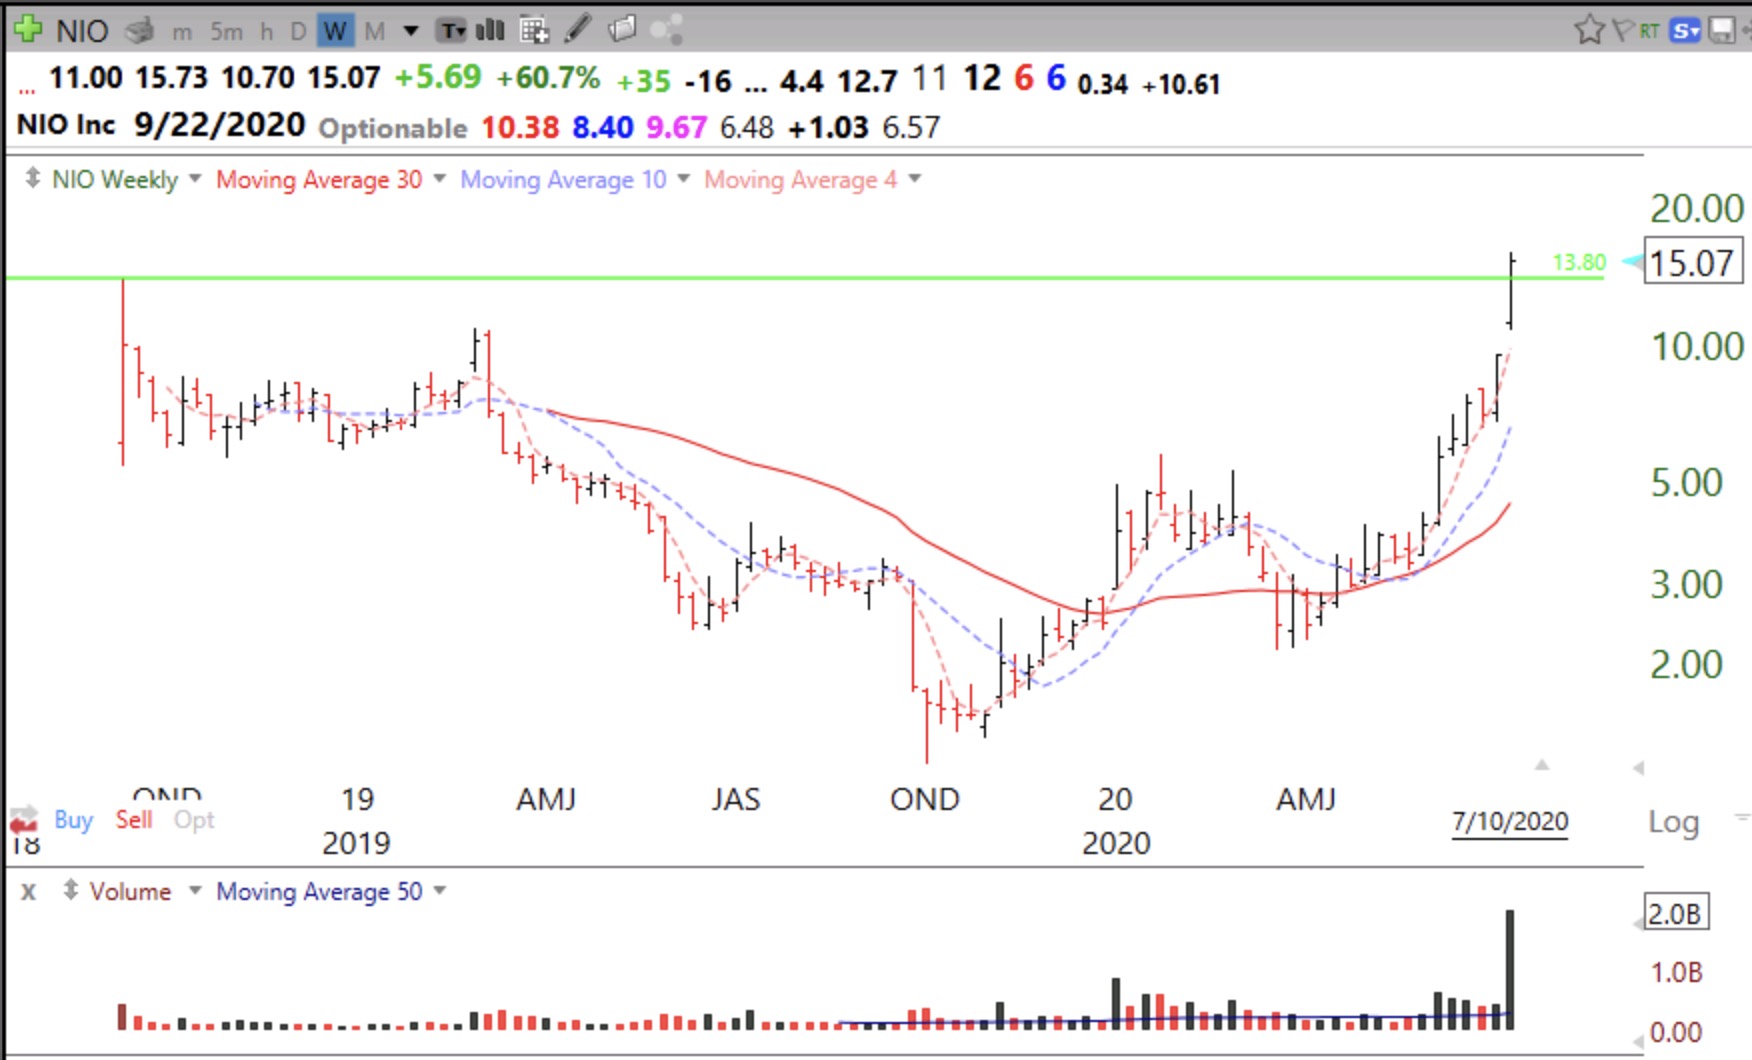
Last week, NIO had a GLB on its highest weekly trading volume ever. Check out this weekly chart. Will it continue rising like a rocket?
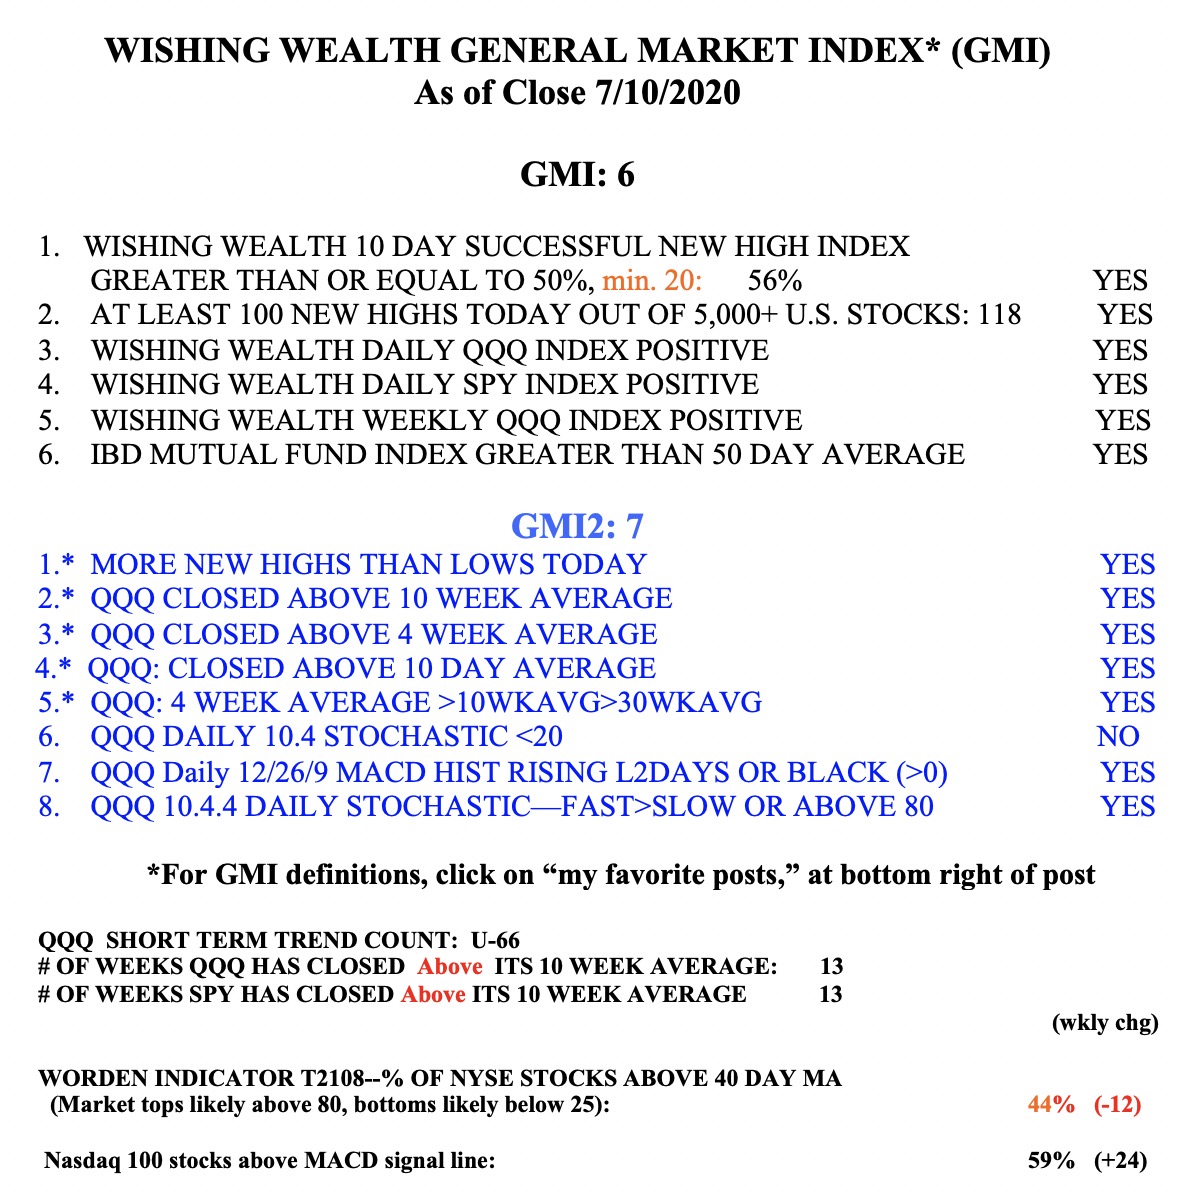
The GMI remains at 6 (of 6).