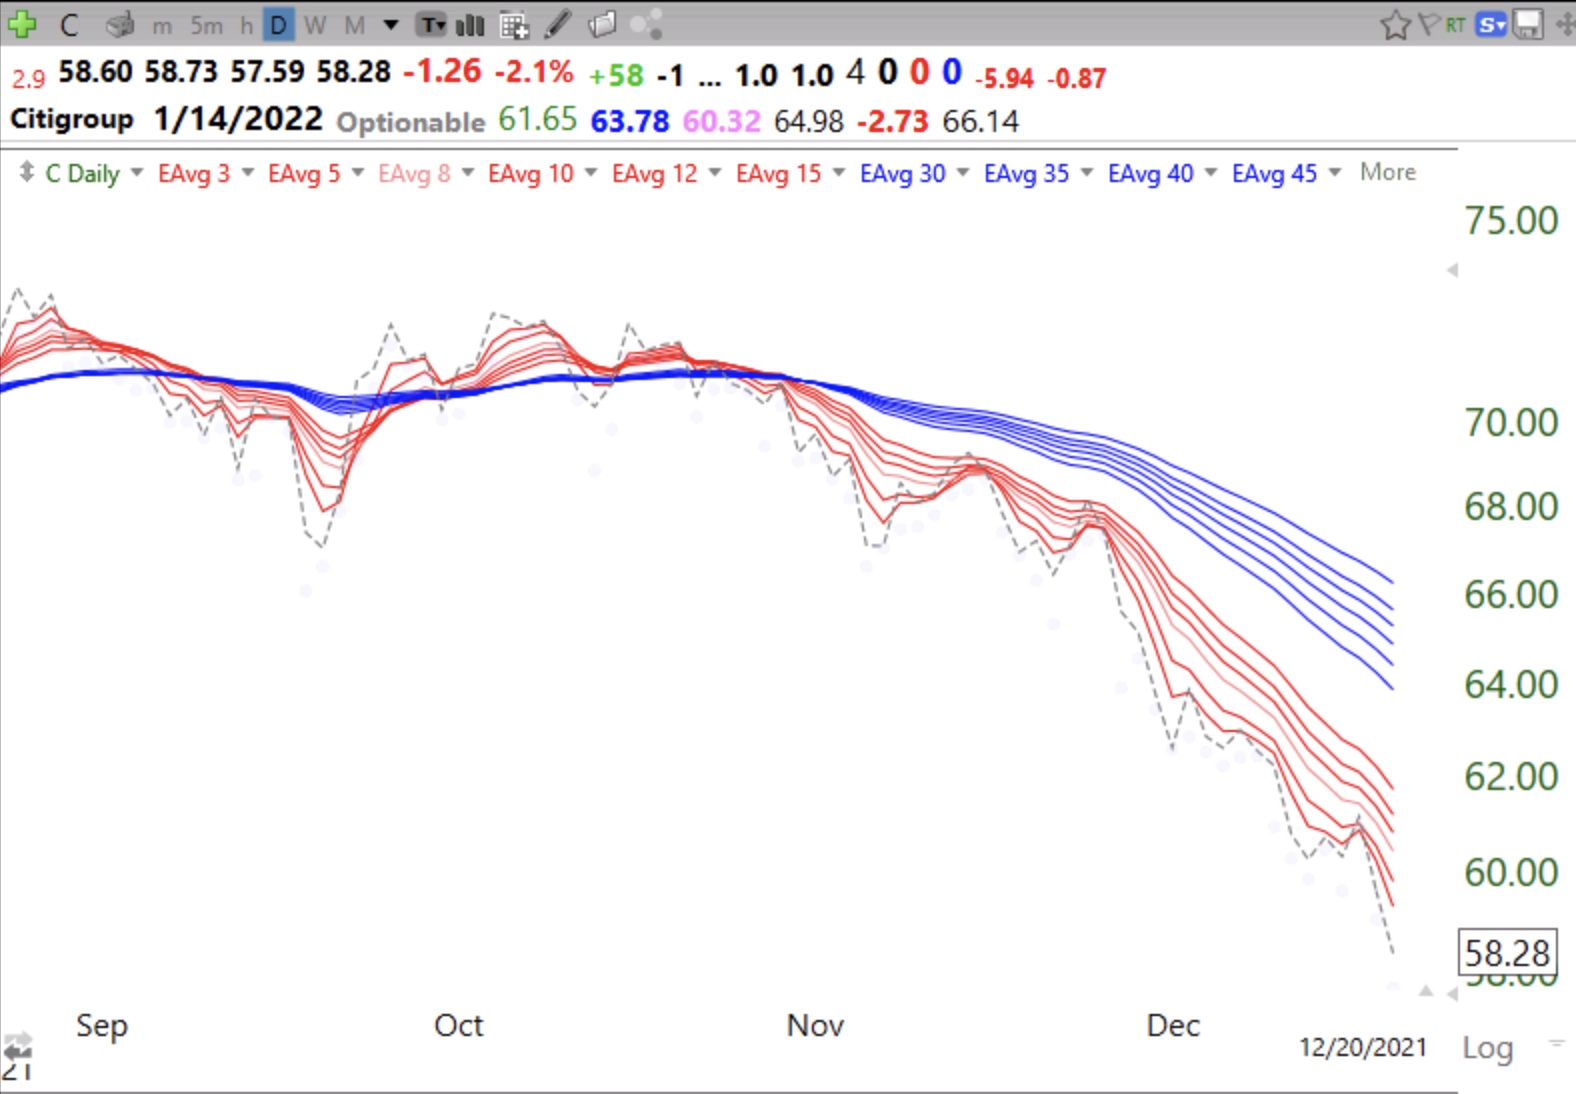
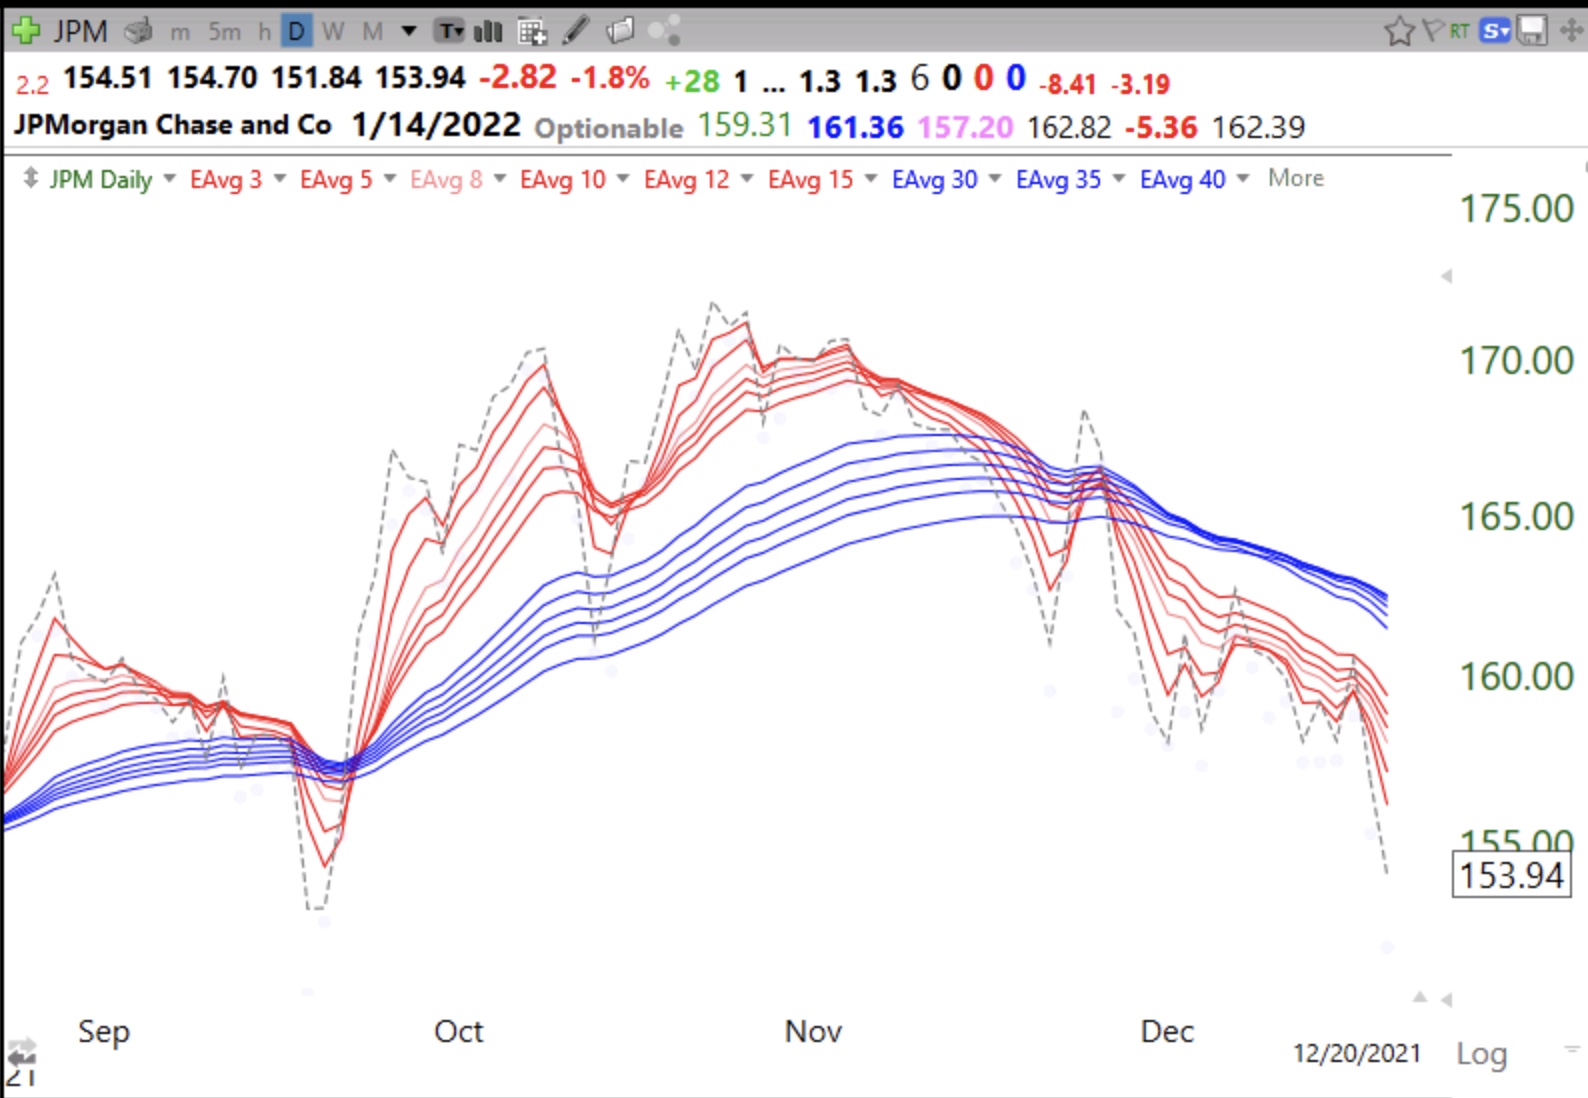
Blog post: Day 5 of $QQQ short term down-trend; Ominous sign–so many banks in BWR down-trends, see charts of $C and $JPM Monday, December 20, 2021 @ 8:31 pm by Dr. Wish GMI1/6 GMI-21/9 T210818%
Blog post: Day 4 of $QQQ short term down-trend; GMI= 2 and could turn Red on Monday; Daily RWB for QQQ gone, see chart Sunday, December 19, 2021 @ 9:36 pm by Dr. Wish GMI2/6 GMI-21/9 T210822%
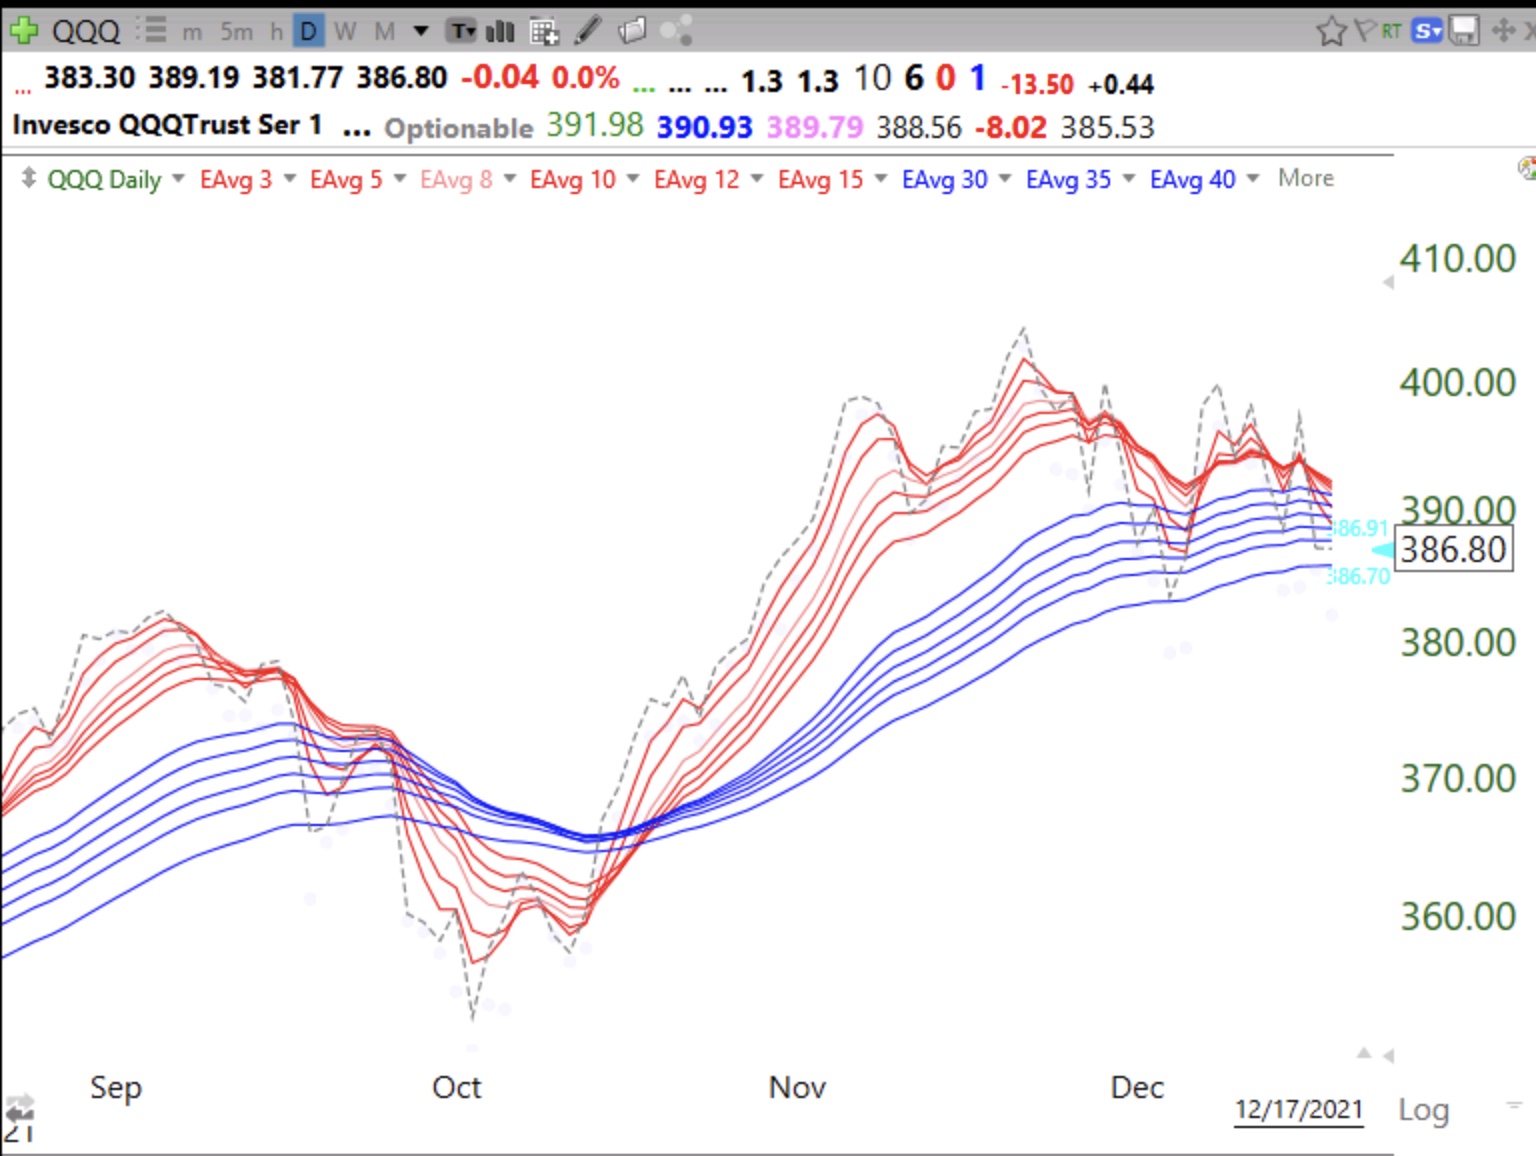
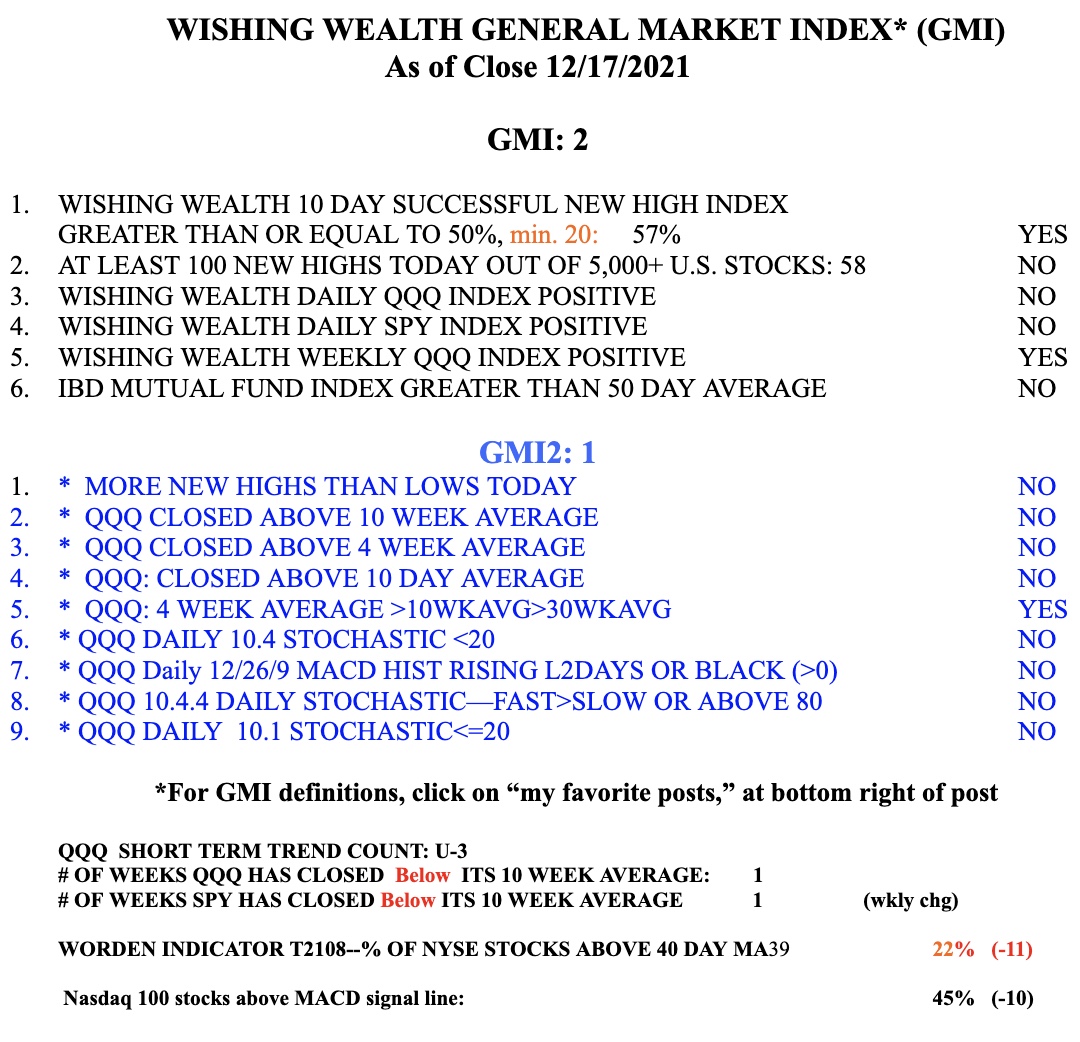
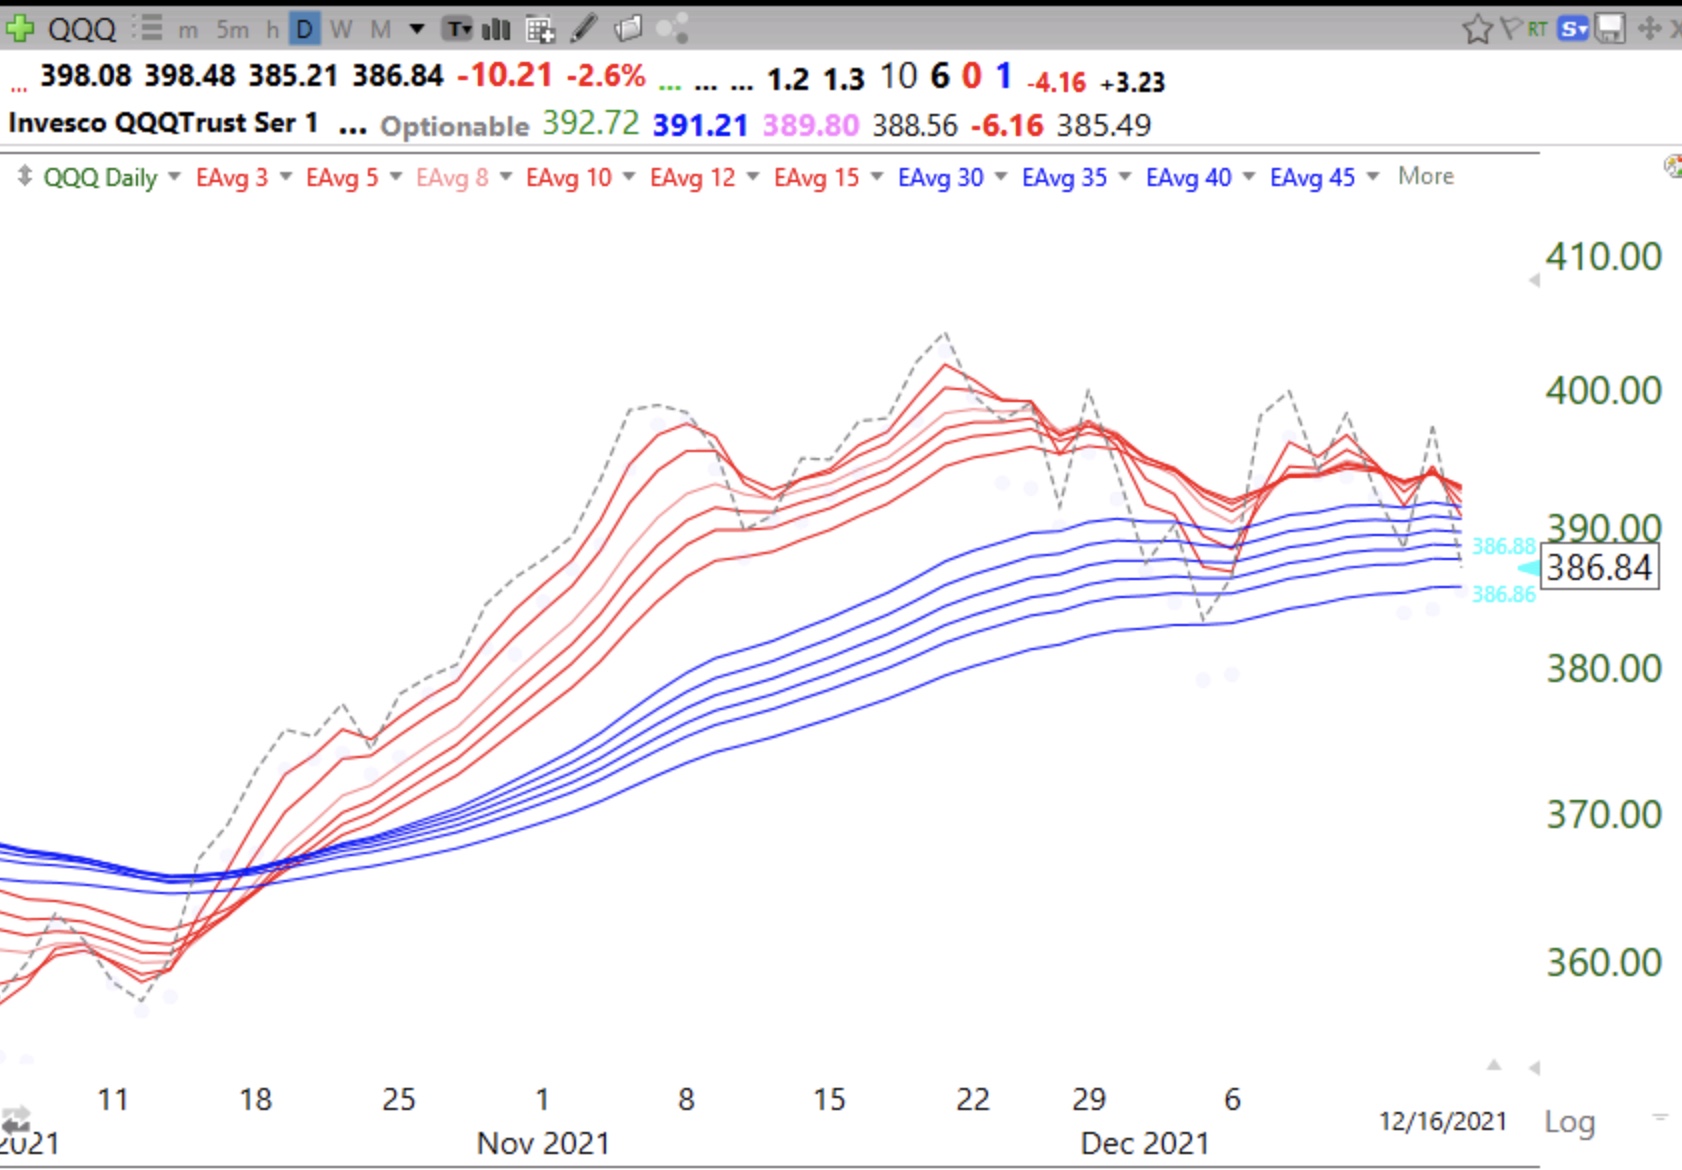
Blog post: Day 3 of $QQQ short term down-trend; Break-outs failing; On sideline Thursday, December 16, 2021 @ 10:17 pm by Dr. Wish GMI4/6 GMI-22/9 T210825%