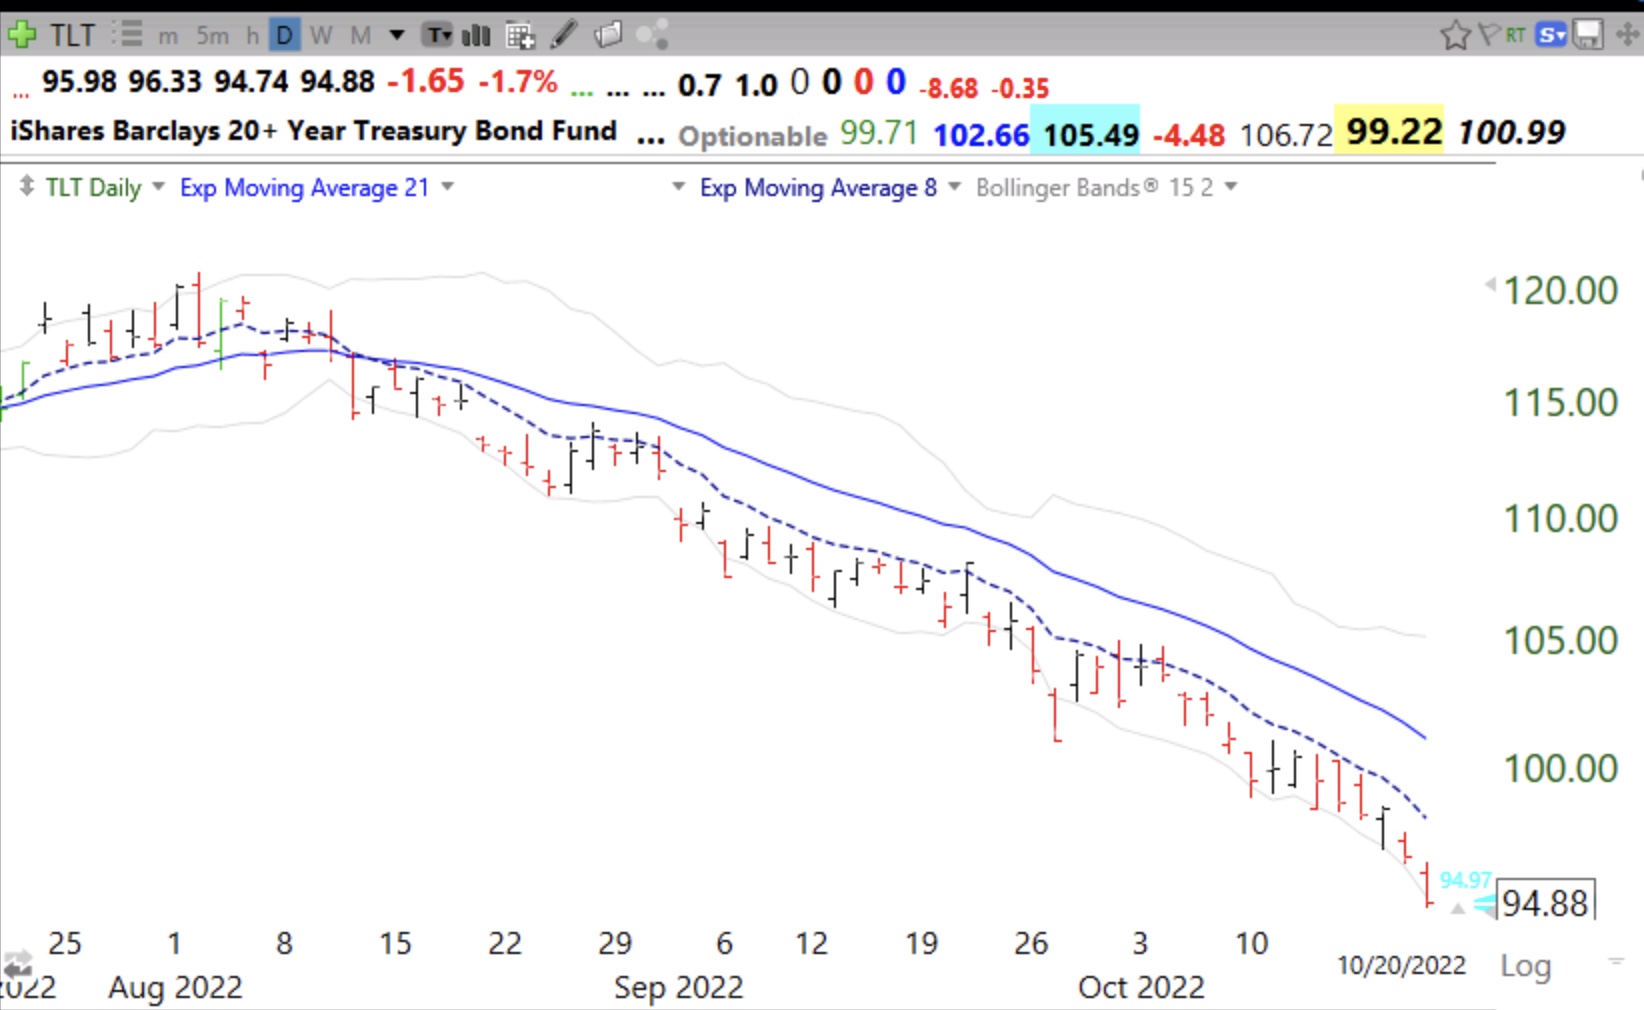
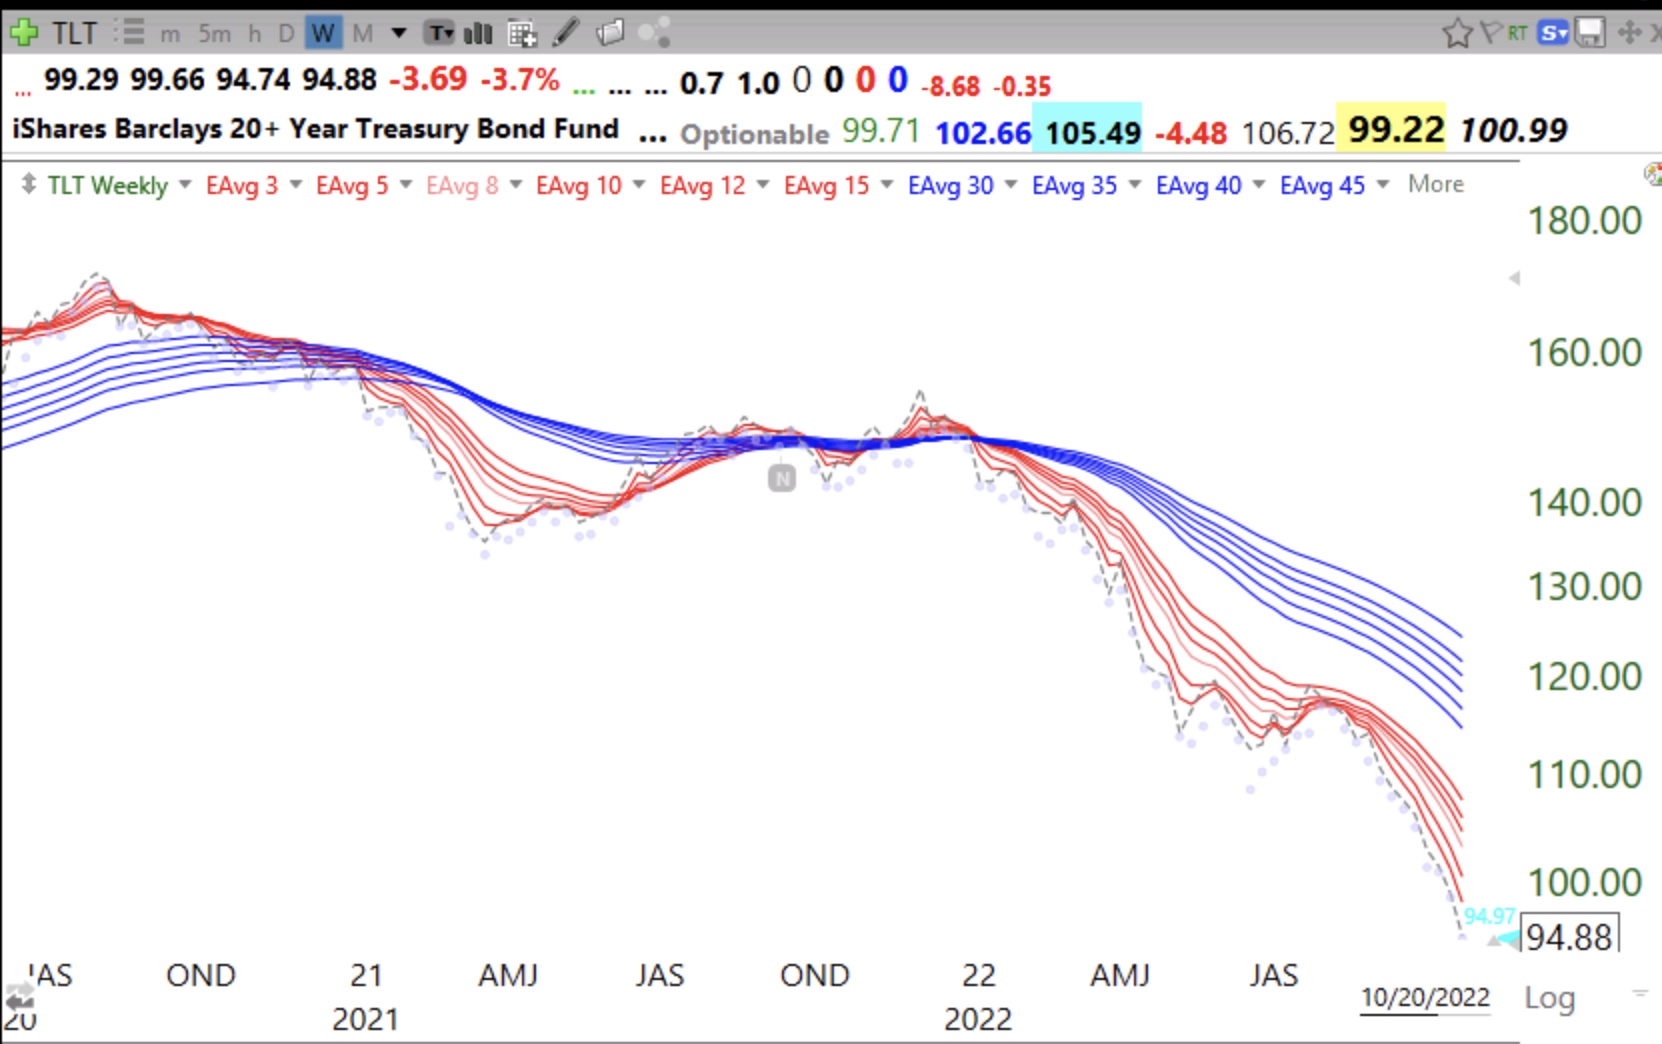
Blog Post: 79 US new highs and 353 new lows; 20 yr treasury bonds continue to sink, $TLT in weekly BWR down-trend Thursday, October 20, 2022 @ 7:51 pm by Dr. Wish GMI1/6 GMI-24/9 T210830% Weekly BWR down-trend.
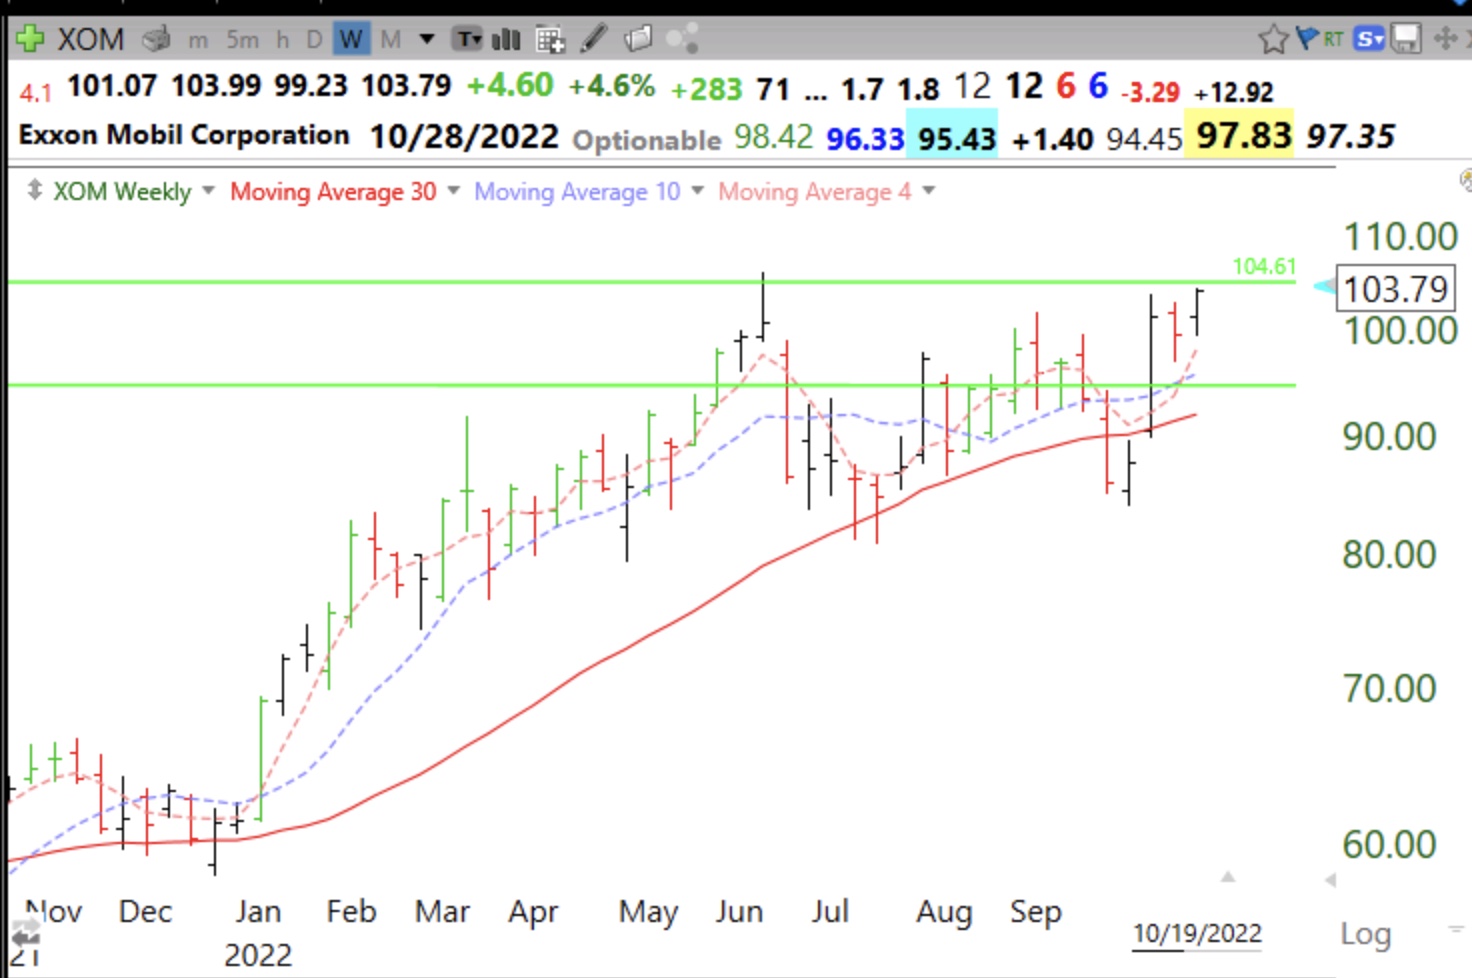
Blog Post: Day 37 of $QQQ short term down-trend; Hard to believe, but $XOM is approaching GLB, see weekly chart Wednesday, October 19, 2022 @ 8:54 pm by Dr. Wish GMI1/6 GMI-24/9 T210834% A close above 104.61 would be a green line break-out (GLB) to an all-time high. See if it does so on above average trading volume. Comp rating= 99, RS=97
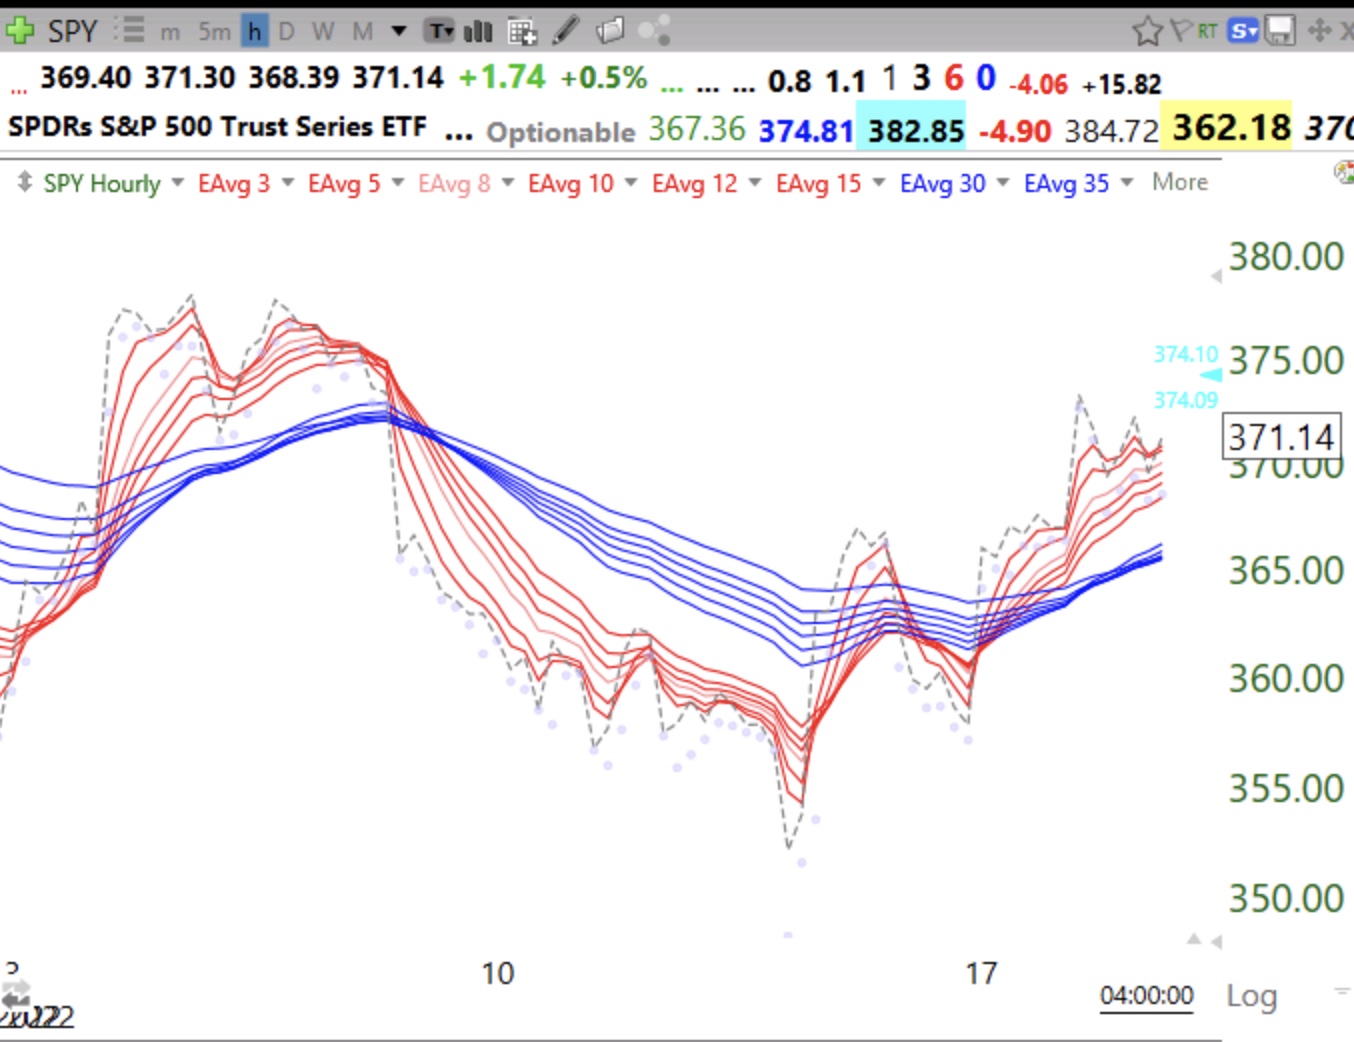
Blog Post: 98 new US highs and 114 lows; $SPY has hourly RWB up-trend, see chart Tuesday, October 18, 2022 @ 8:02 pm by Dr. Wish GMI1/6 GMI-24/9 T210838% So do DIA and QQQ.