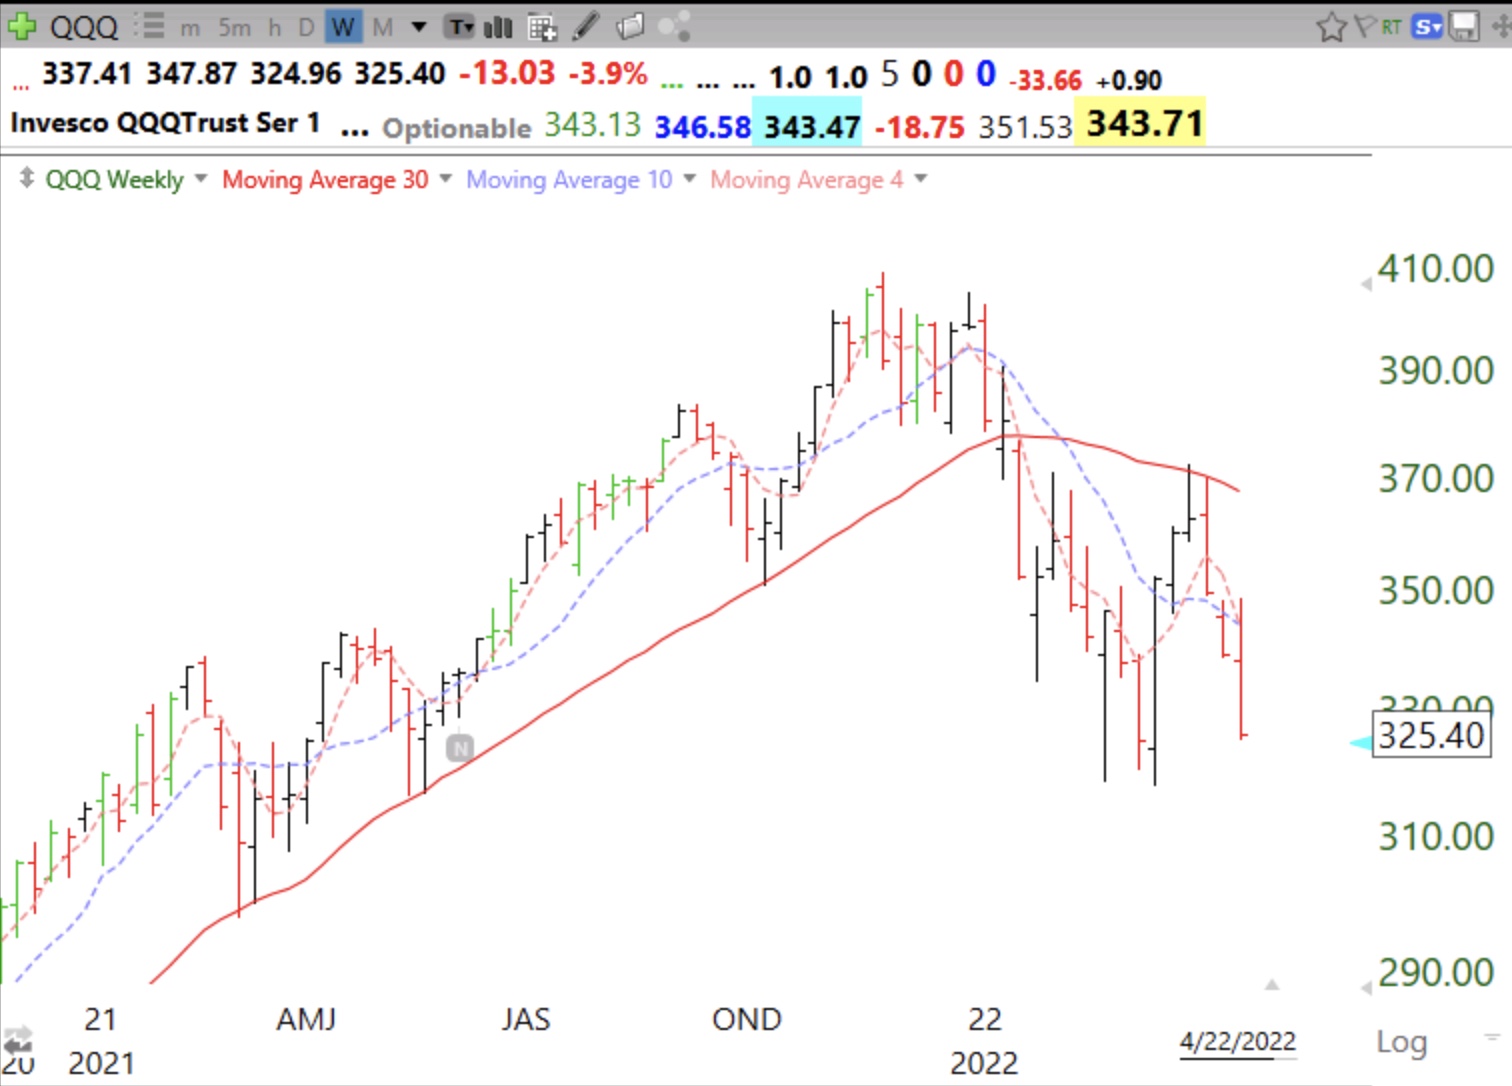
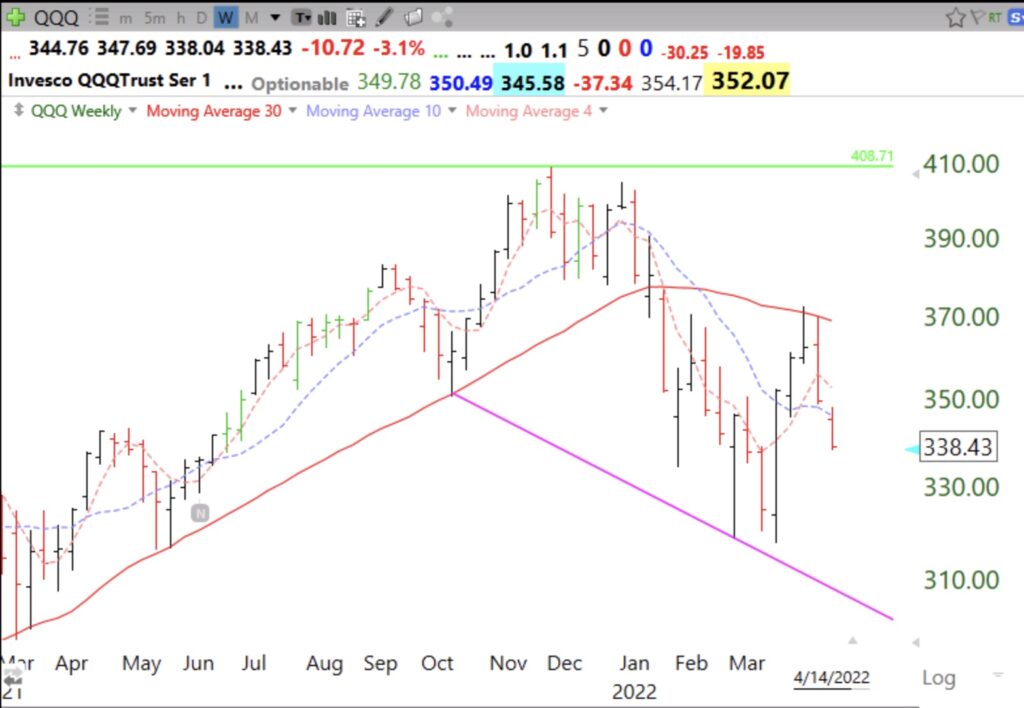
I cannot see any reason to be invested long in the traditional growth and tech stocks. Why fight the receding tide? The purple line in this weekly chart of QQQ shows a possible place where this index could find support. It looks to me like a very weak head and shoulders top pattern has formed. I have to note that after the 30 week average (red solid line) has begun to decline it has often signaled the BEGINNING of a huge decline. When the 30 week average declines it means the current price is lower than the one 31 weeks ago that is being dropped from the moving average.
It is critical not to marry a scenario, however, and to remain flexible. Follow the trend don’t try to predict it. The sentiment is so bearish right now with everybody fearing the Fed’s tightening. And yet the market never behaves consistent with the majority’s opinions. I am glad I went to cash in my pension accounts starting in November. I still nibble at a a few things in my trading iRA but I make small bets and run when a loss develops.
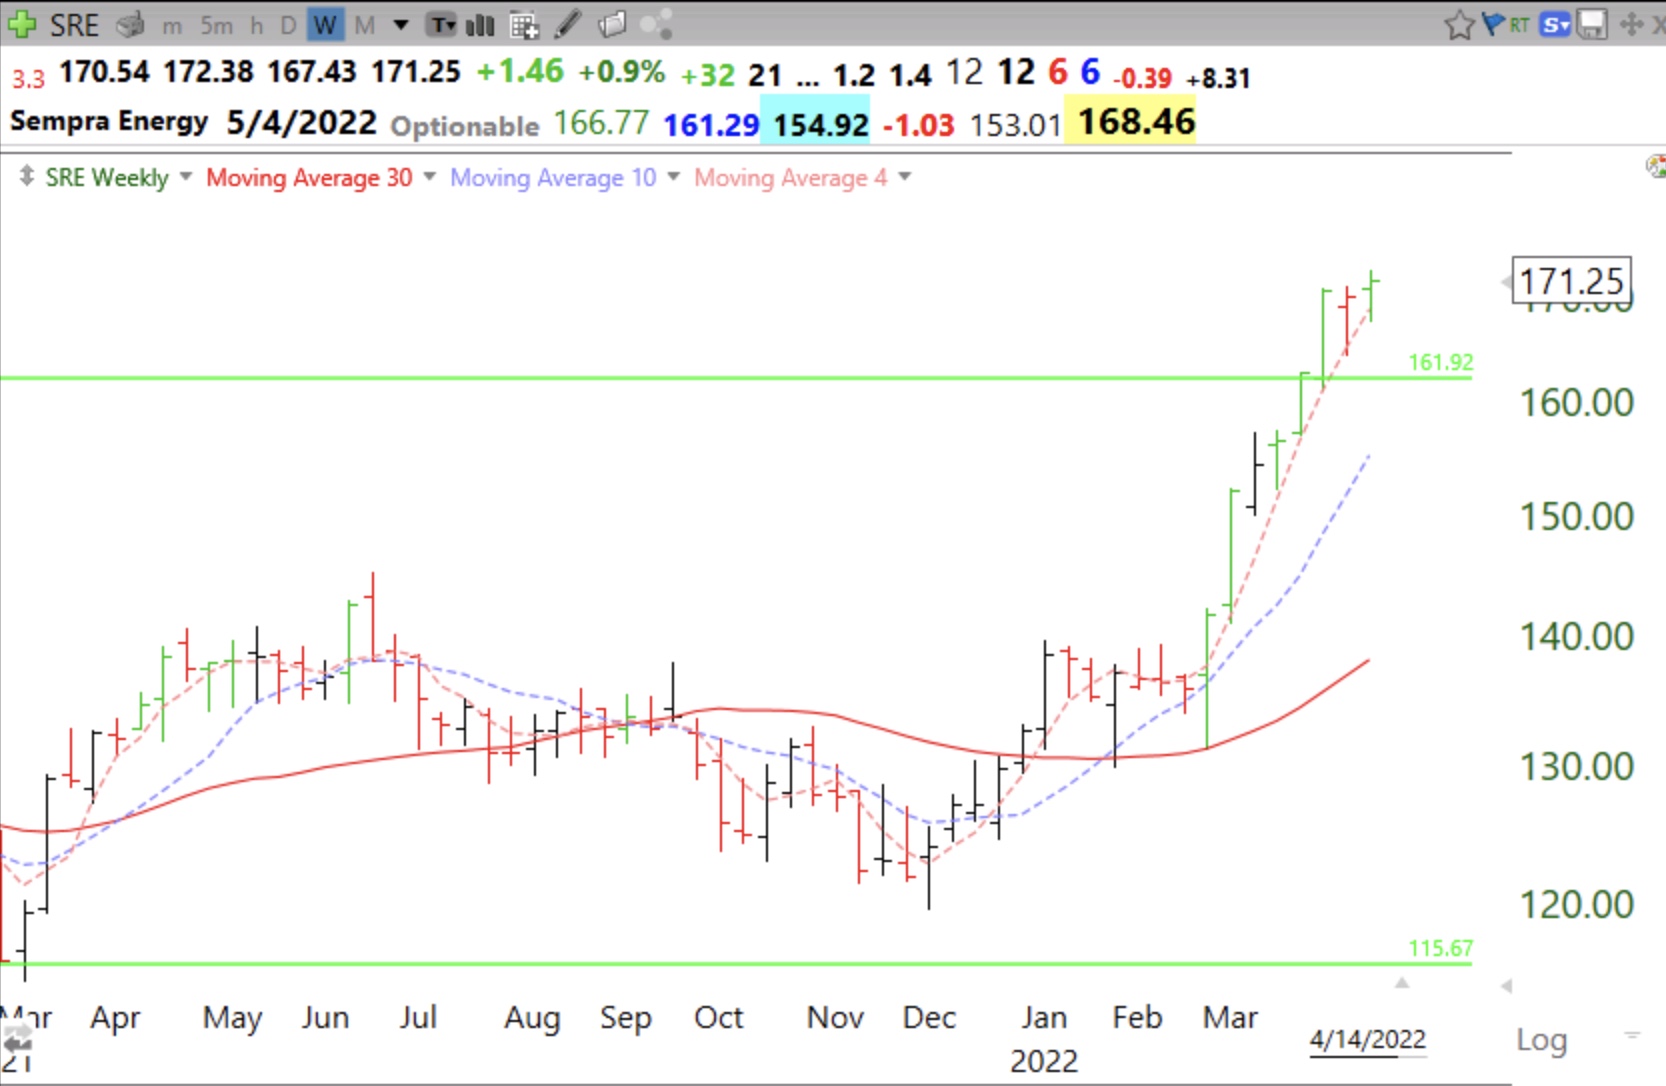
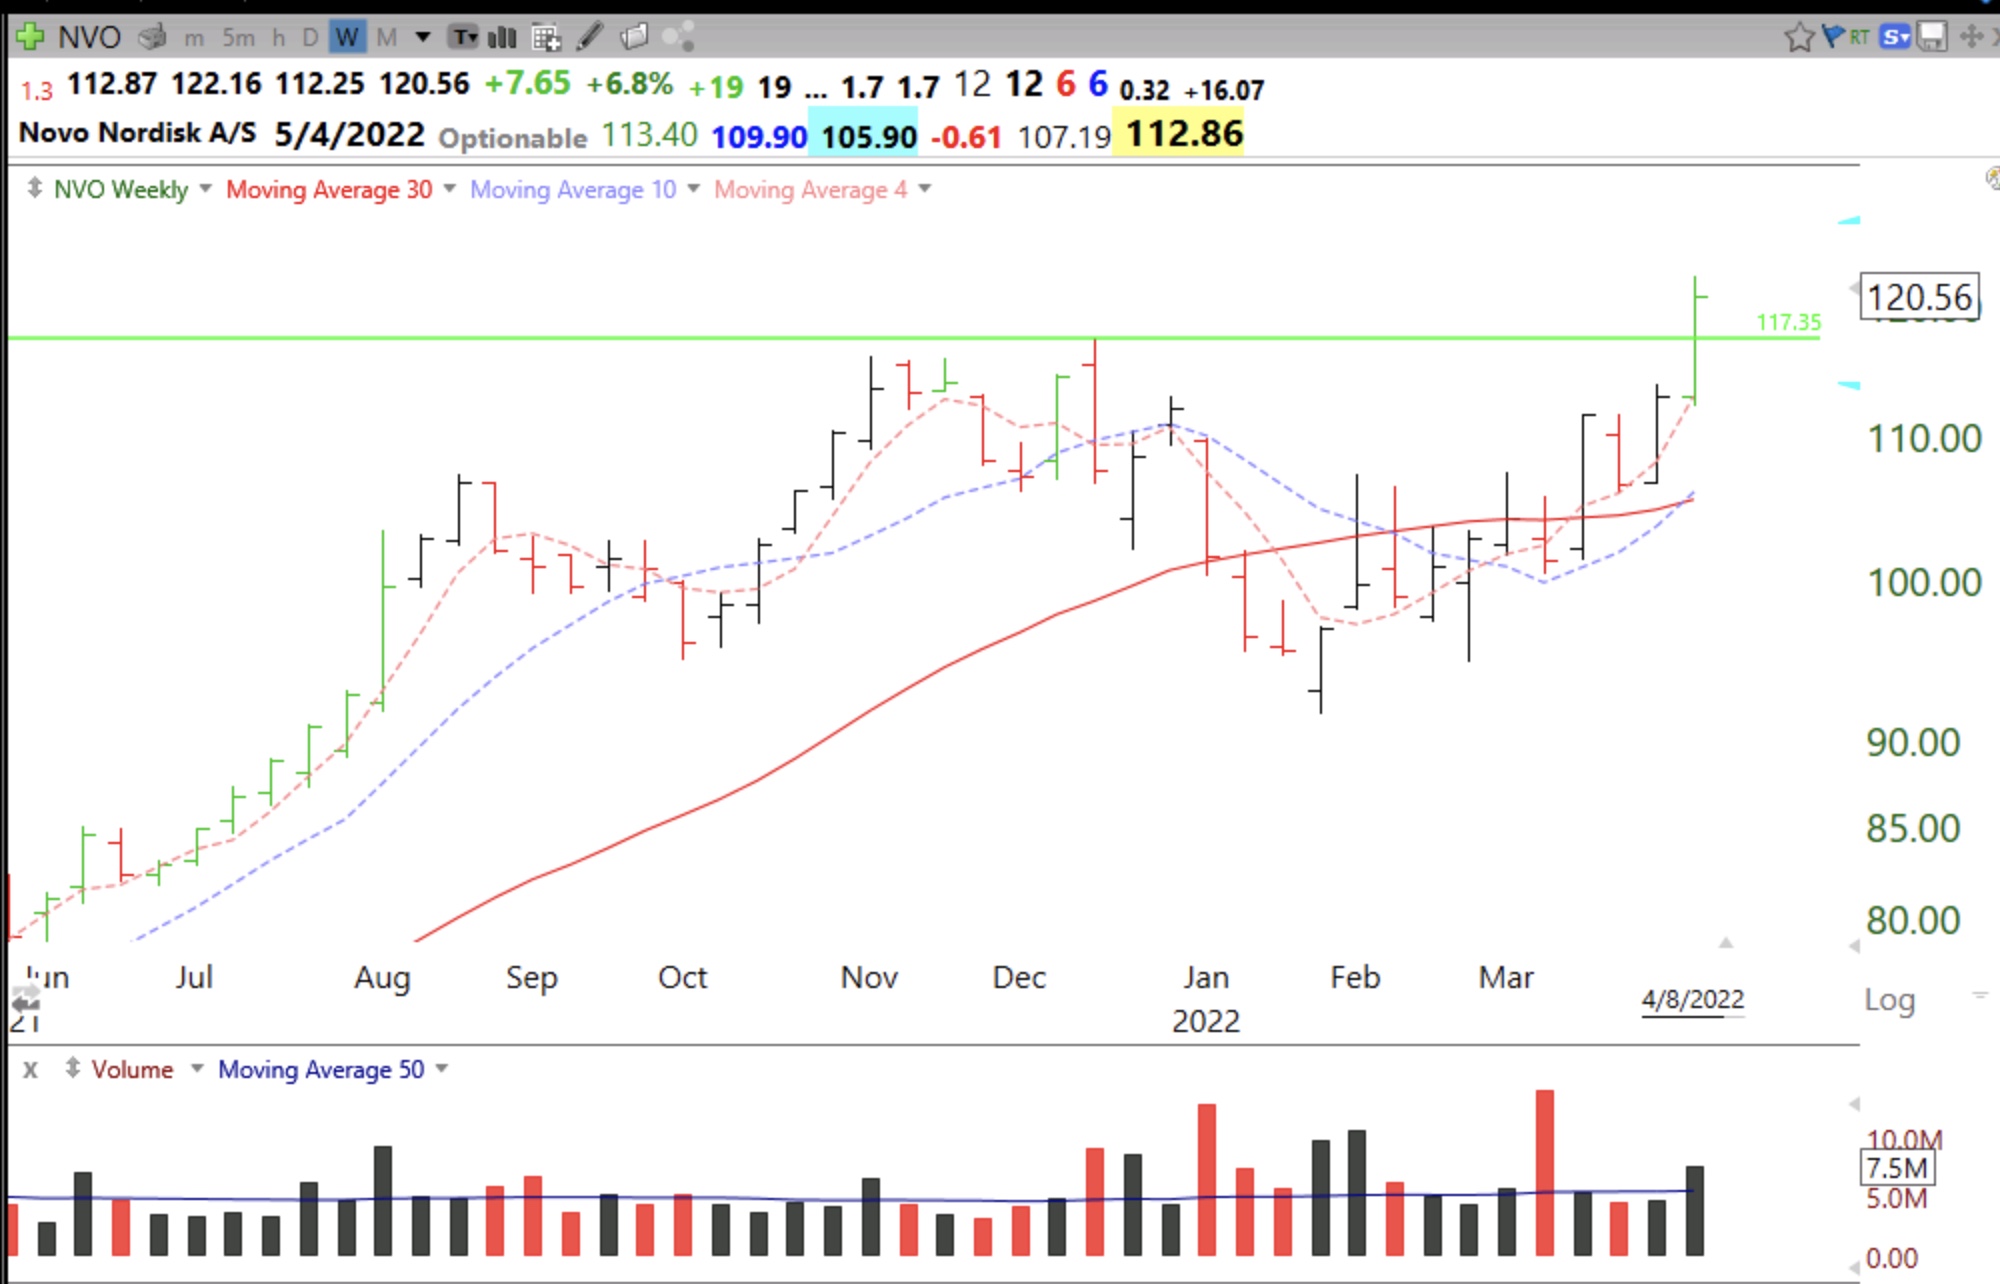
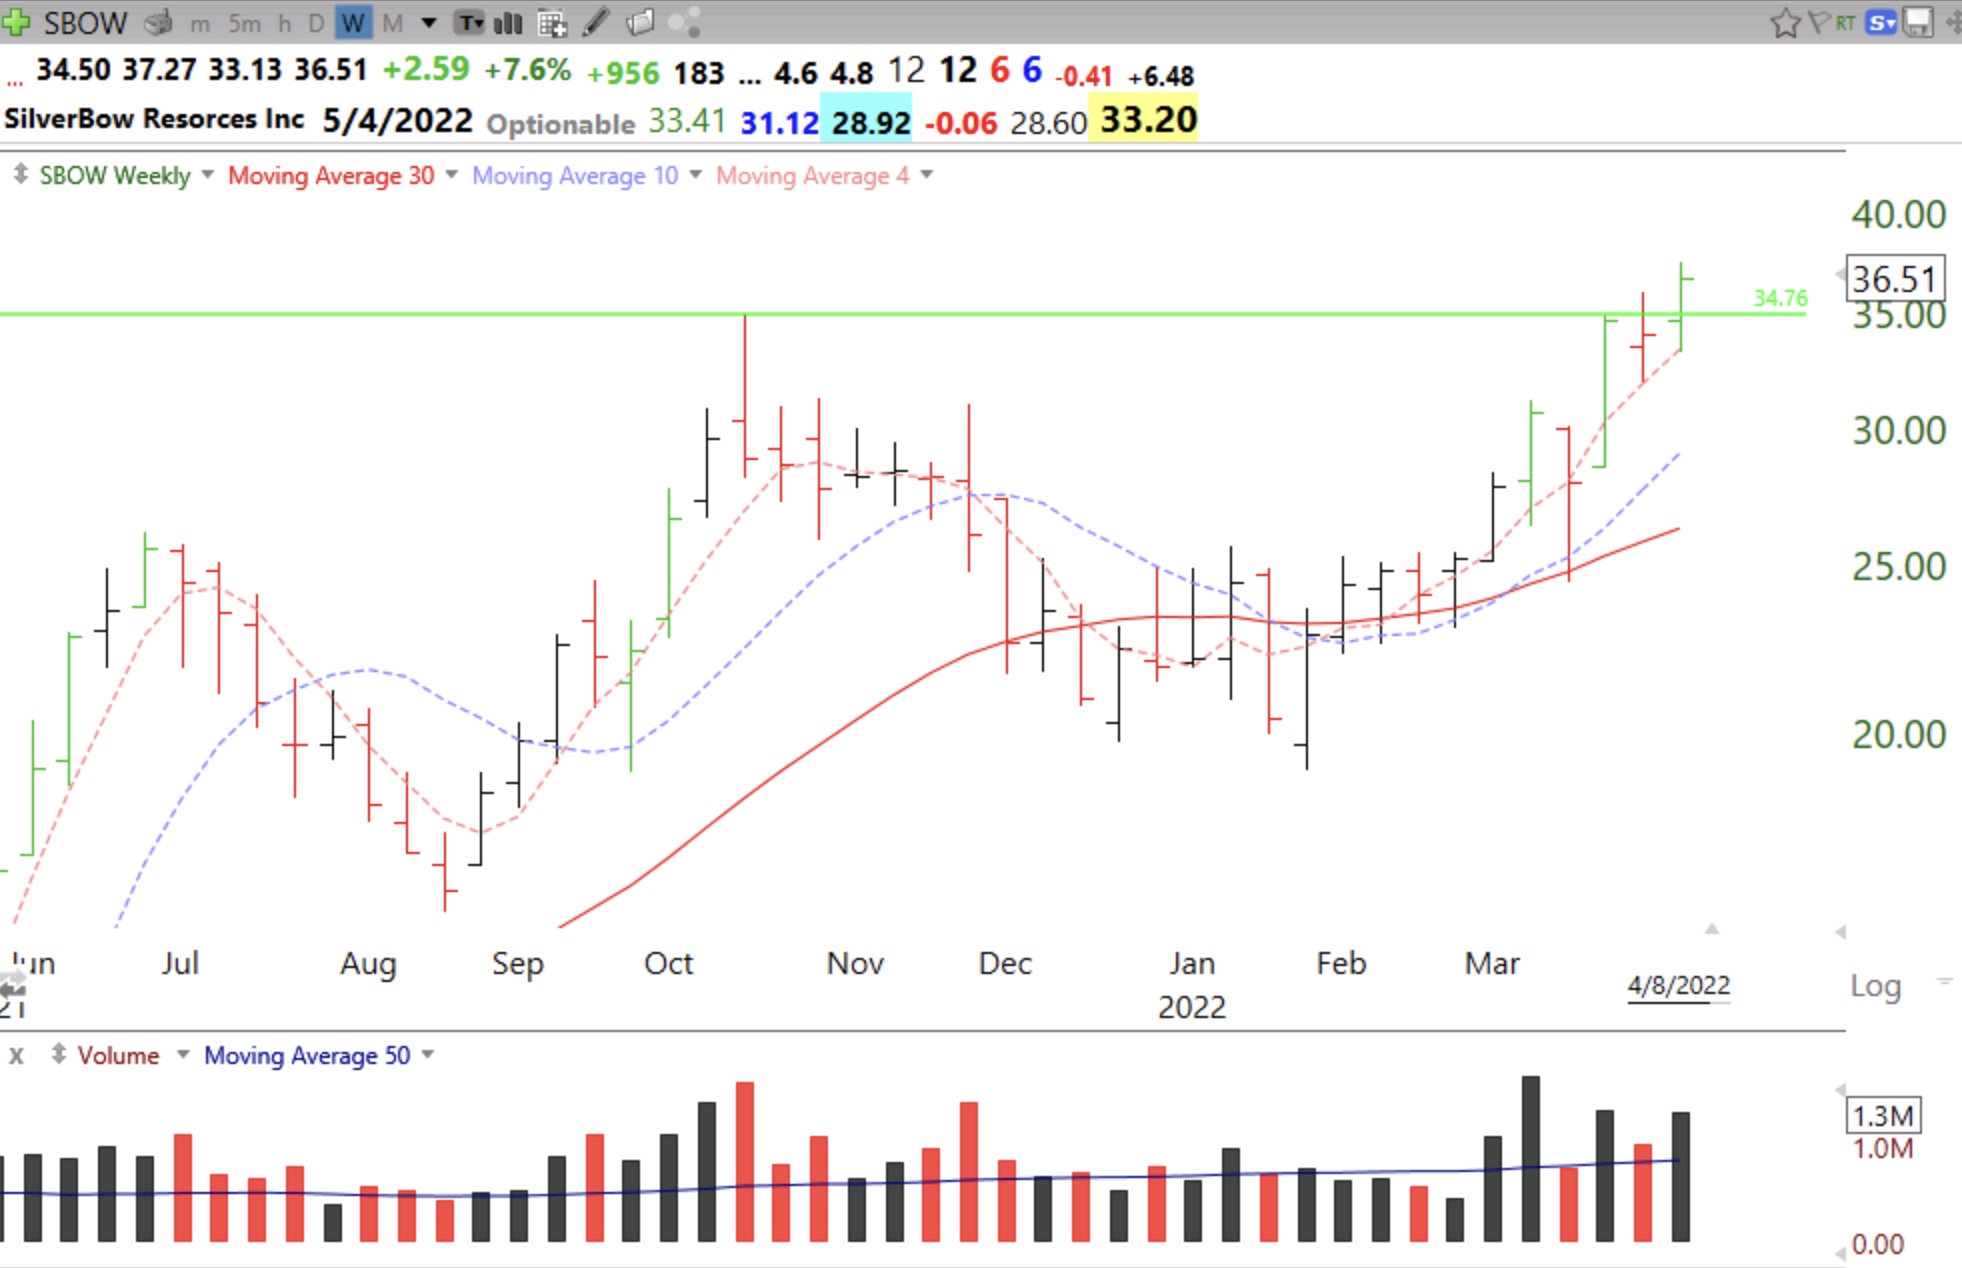
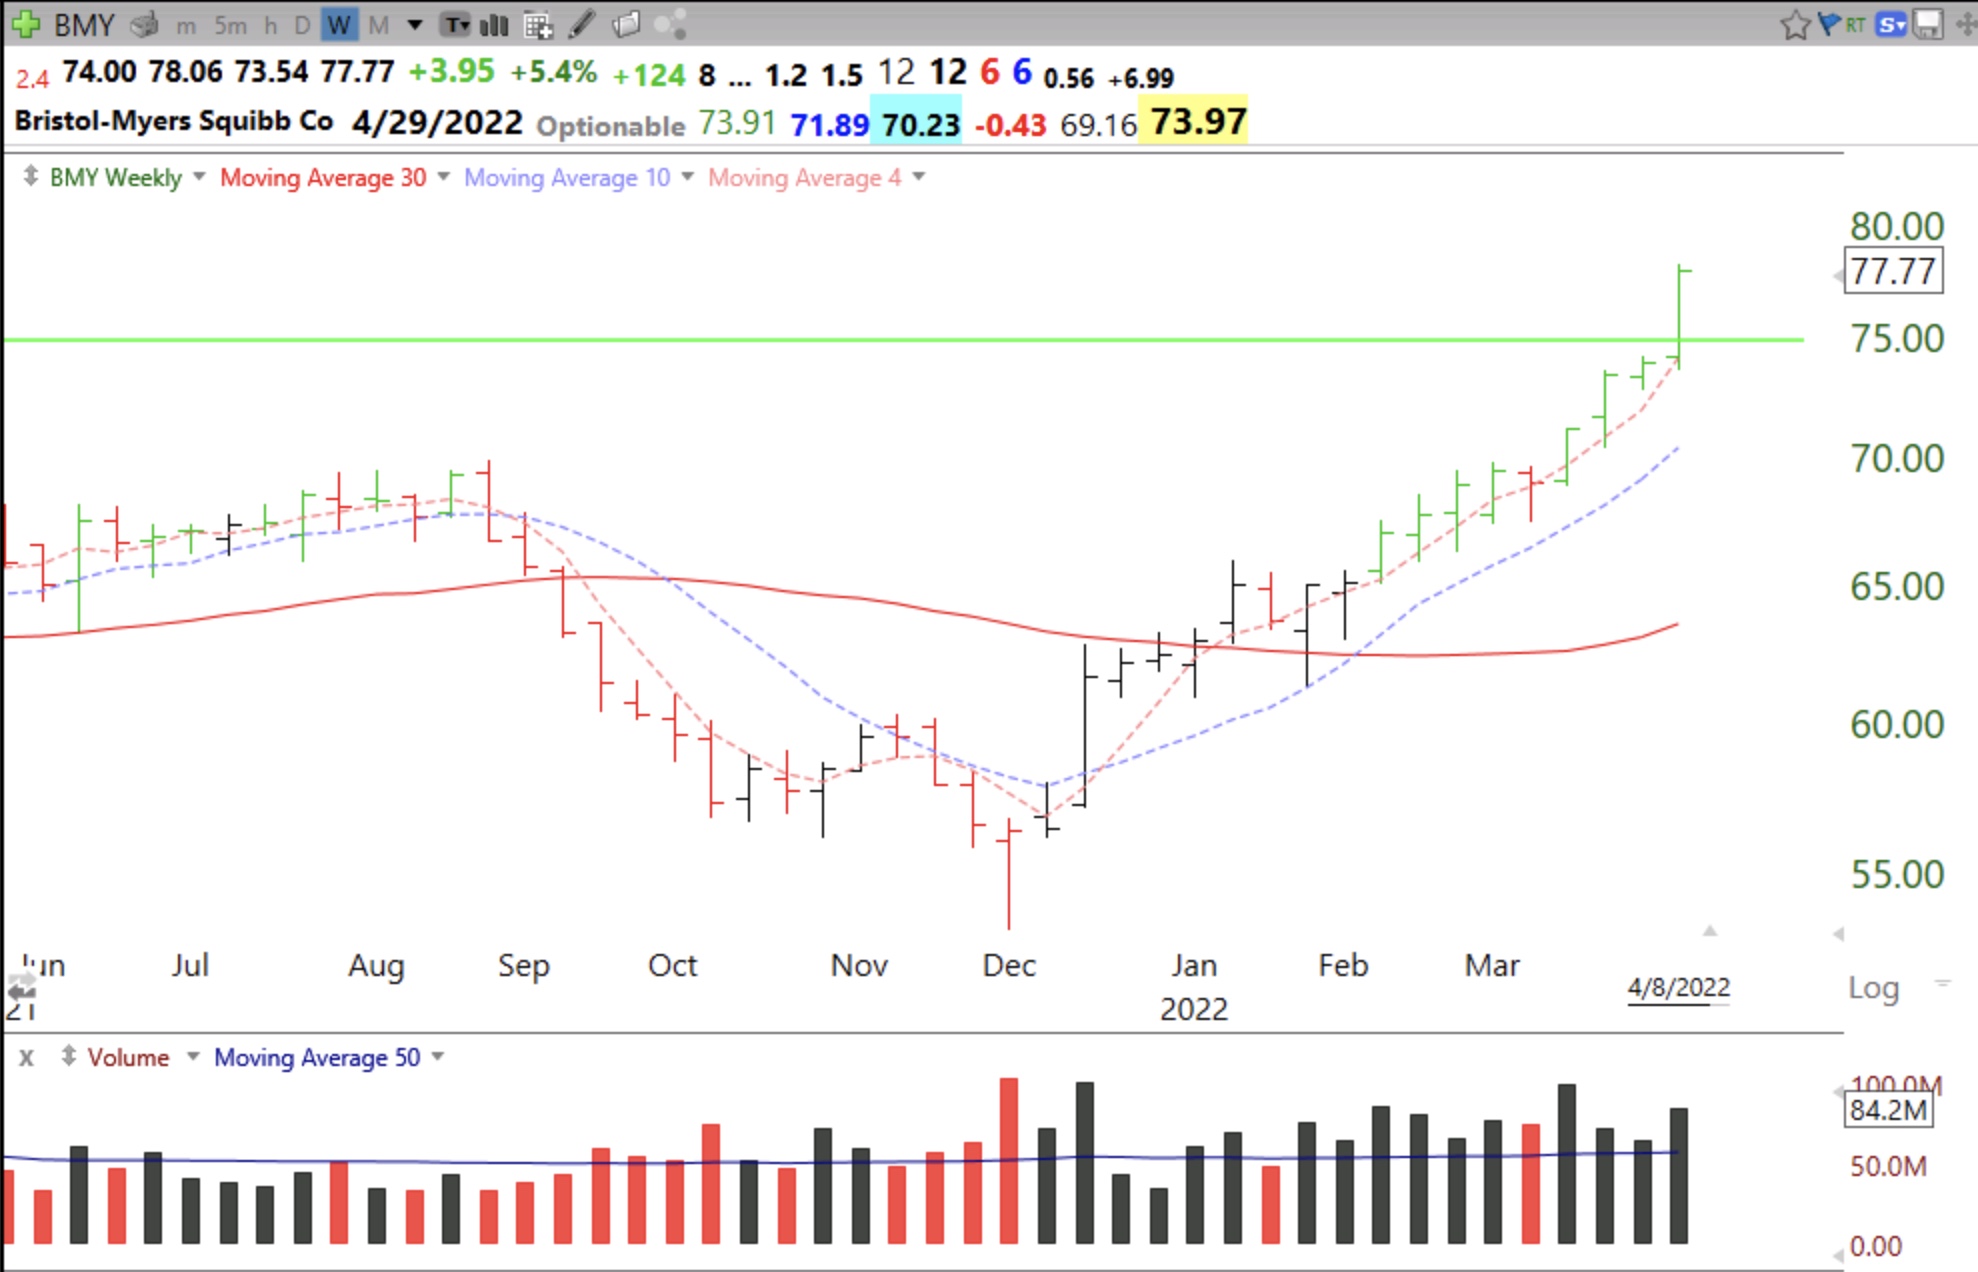
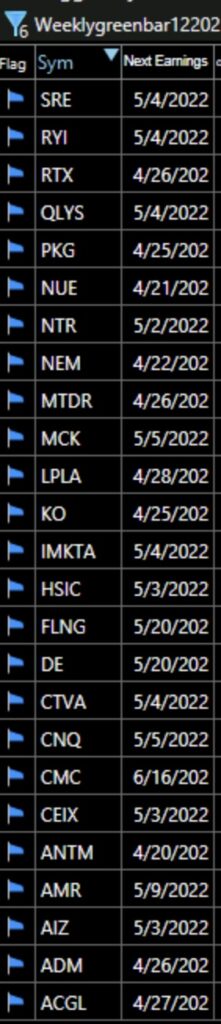
There are still many stocks hitting ATHs (all-time highs) in commodities, agriculture, oil drilling and defense. Here is a list of stocks that came up in my WeeklyGreenBar scan using TC2000. (I will eventually make these scans available to others to run.) All of the stocks scanned came from my IBD/MarketSmith watchlist of stocks mentioned recently by these invaluable services. These stocks all bounced up off of their 4 week averages last week and had relative strength (vs S&P500) hit a 20 week high last week and all hit an ATH last week. For this setup I would sell if a stock trades back below last week’s low.
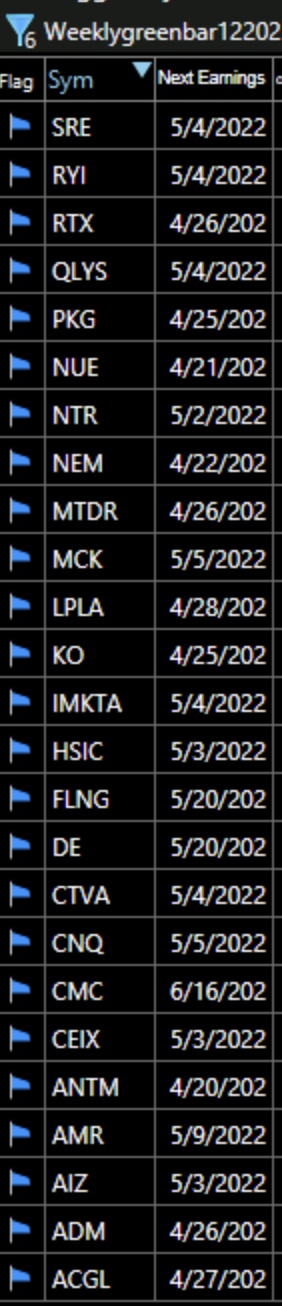
Here is an example of how I would trade this set-up. SRE has the powerful up-trend pattern of 4wk avg (red dotted line) rising above the 10 week avg (purple dotted line) which is rising above the 30 wk avg (red solid line). The latter is indicative of a Stage 2 up-trend. Last week’s price bar fell to just below/near the rising 4 wk avg and closed above it, and closed the week higher than the week before. This results in my green bar signal. (The prior week did not close higher than the week before and is therefore not green.) The fact that the stock also had a GLB (green line break-out to an ATH) is another plus but not required by this scan. A GLB signifies that a stock reached an ATH, consolidated for a minimum of 3 months and then broke out to a new ATH.
Please note this golden nugget: an advancing stock rides its rising 4 wk avg for many weeks. SRE has done so for the past 8 wks. How long will this advance last? No one knows. But if I owned SRE I would lighten up or sell all when it ends a week below its 4 wk avg. The final exit would come with a close below the 10 wk avg. I could also trail my stop at each subsequent green bar’s low.
The beauty of this technique is that one does not have to be glued to a monitor. One could purchase SRE on Monday (or before the close Friday), for example, put a stop loss order in to sell just below last week’s low and go about one’s business. The great Nicolas Darvas (whose books, listed below, are required reading) made his fortune while he was dancing around the world. Darvas could not watch his stocks when the markets were open. There were no computers then in the 50s and he did not contact his broker but got most of his stock information on the weekends from Barron’s magazine. The great William O’Neil relied on weekly charts too. Most of us do not want to be day traders. We just want to make a decent return over time and get on with our careers. SRE is just an example, I do not own it.

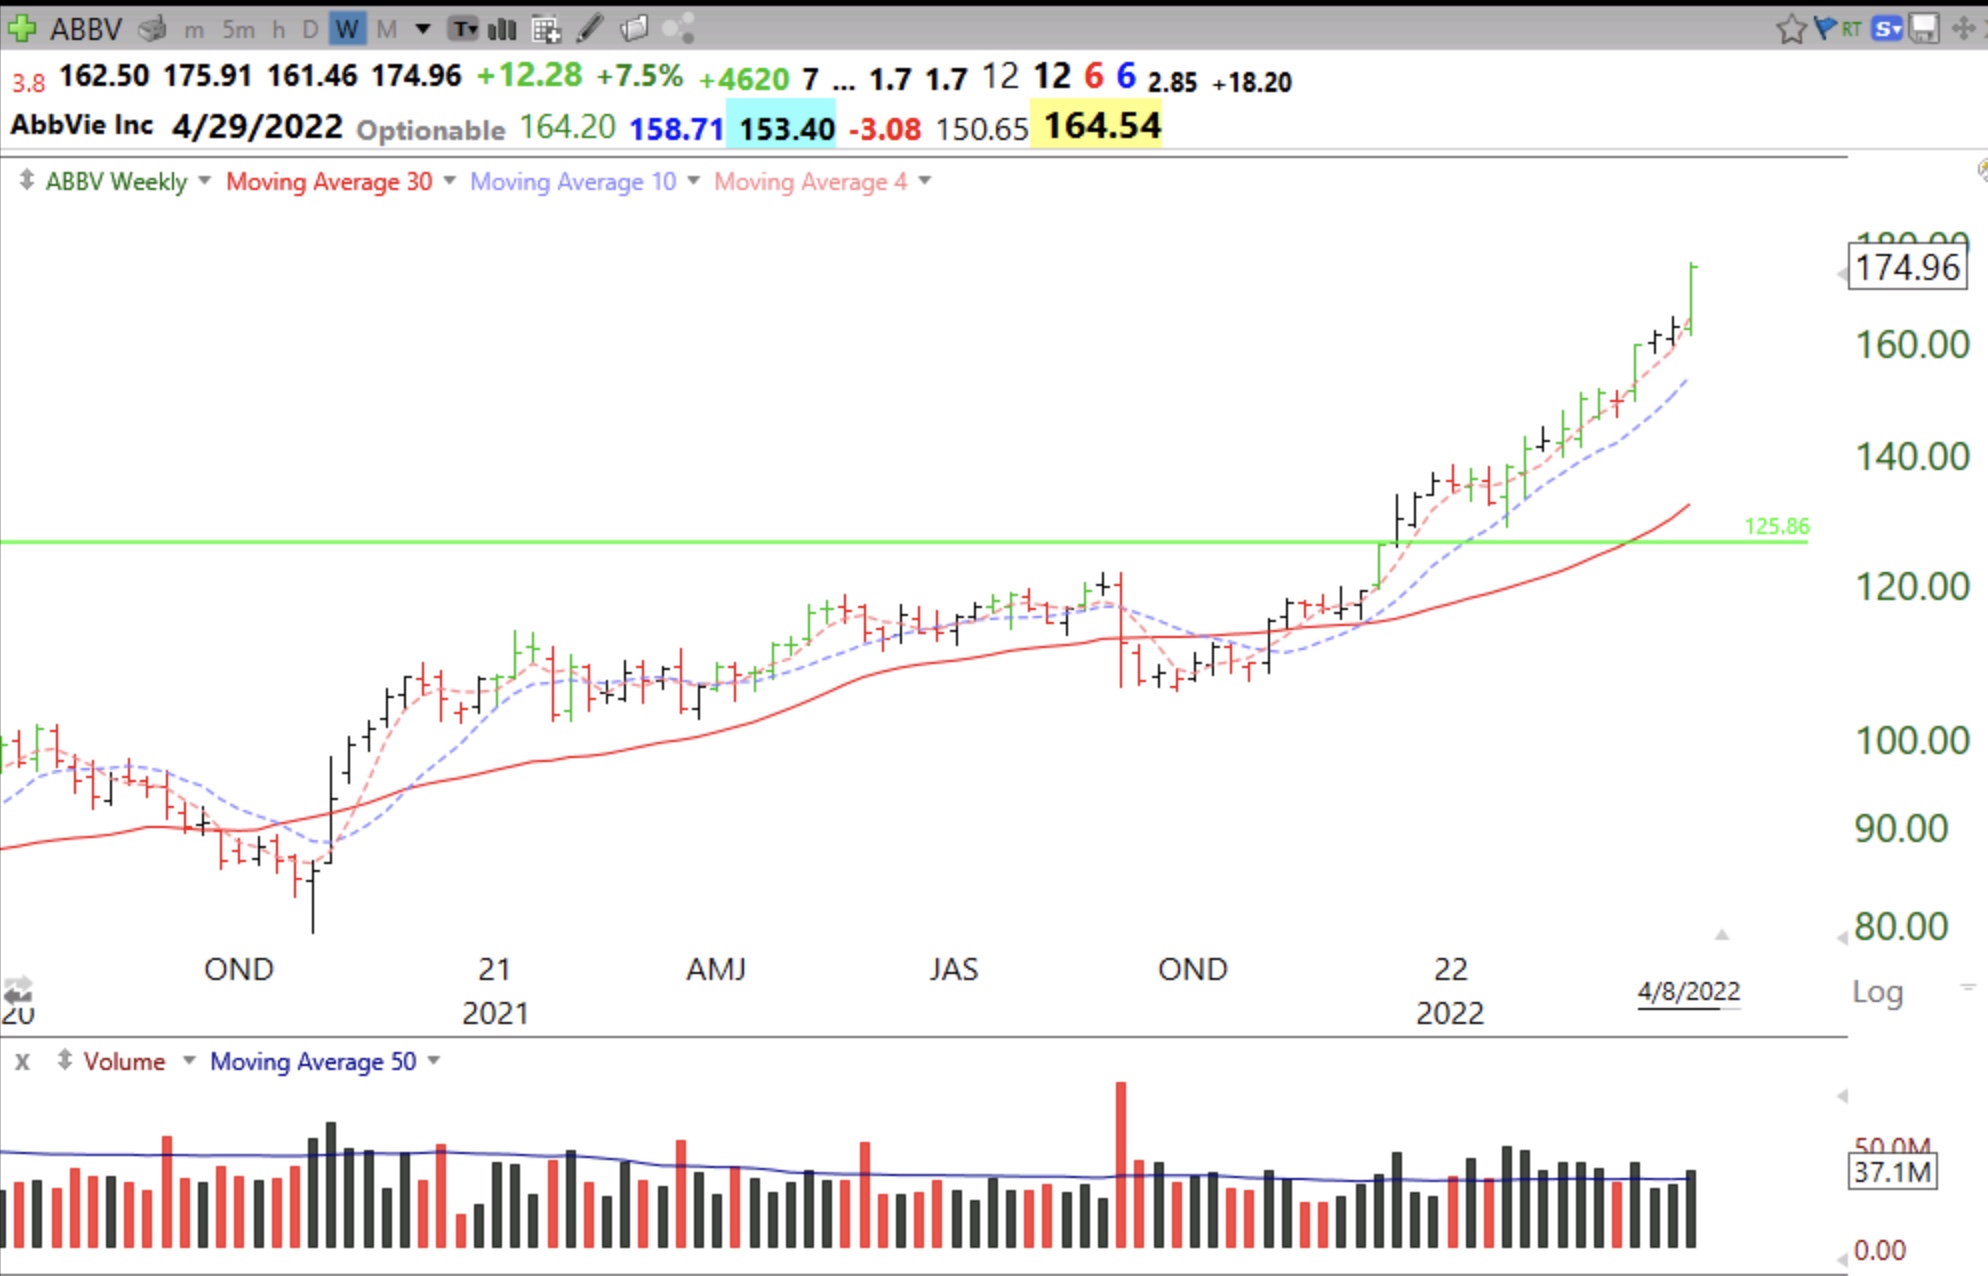
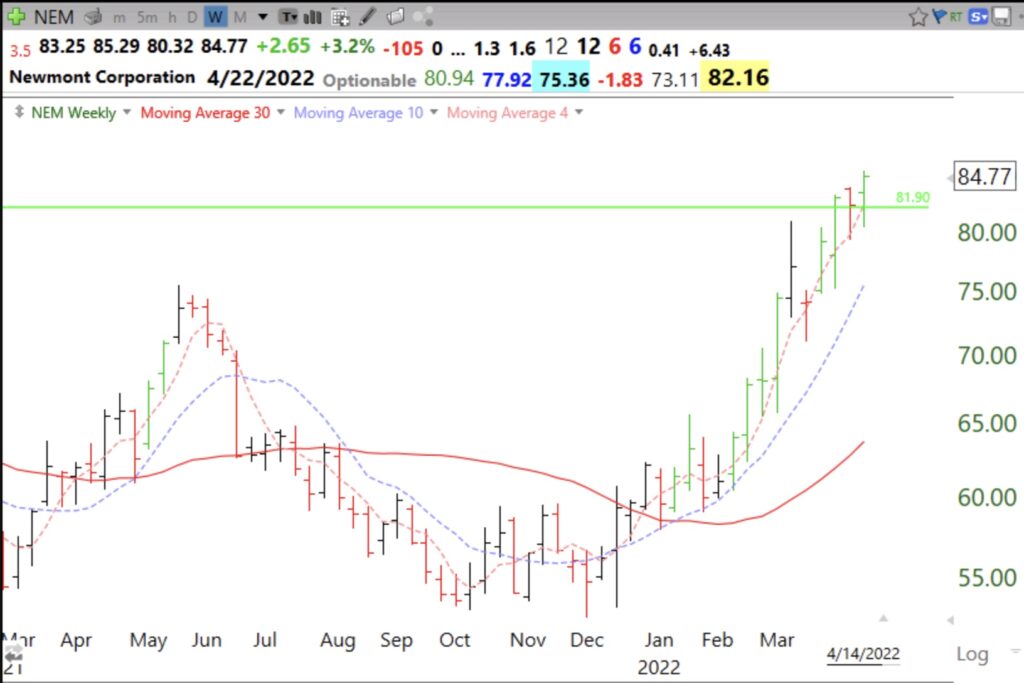
Here is one more example from the list above. Study it and learn.
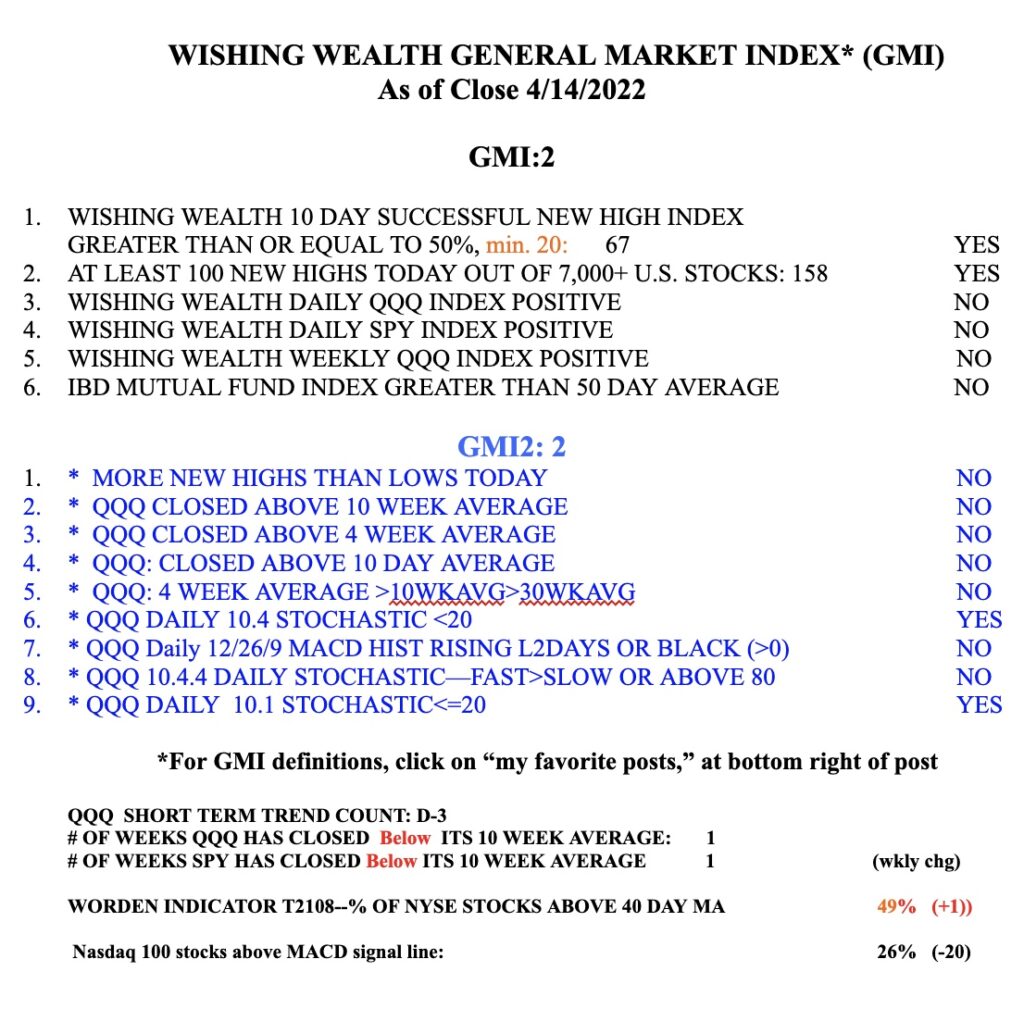
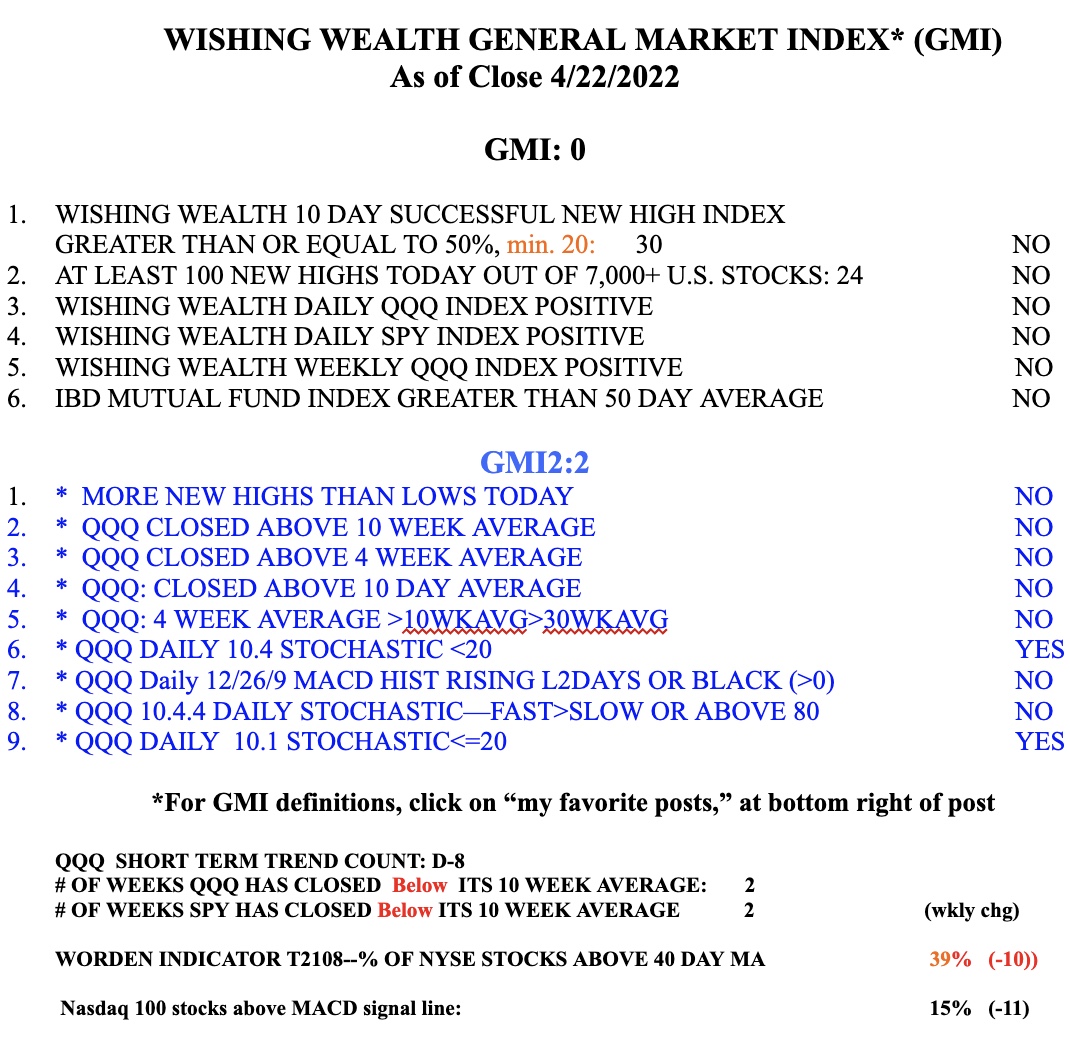
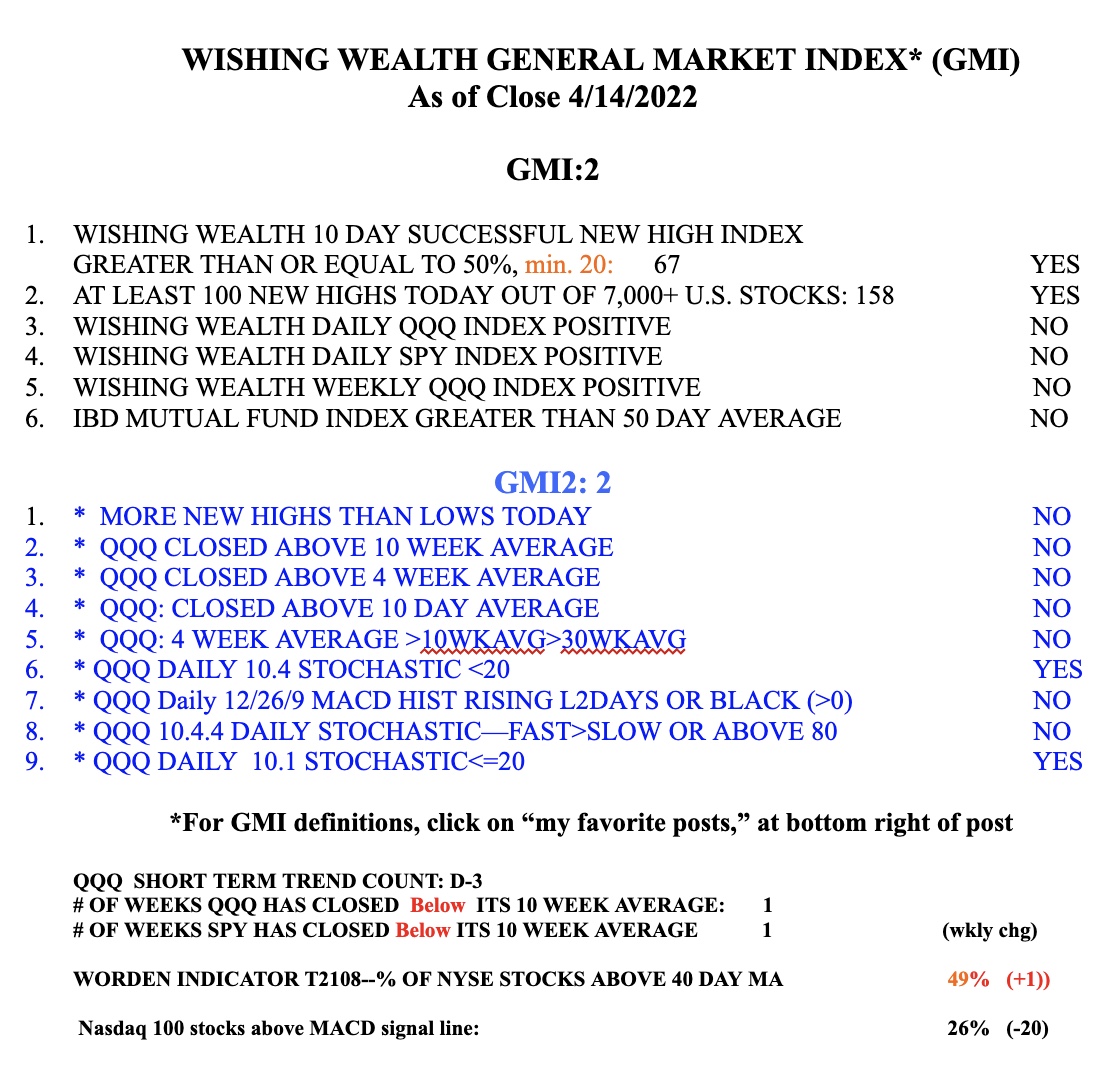
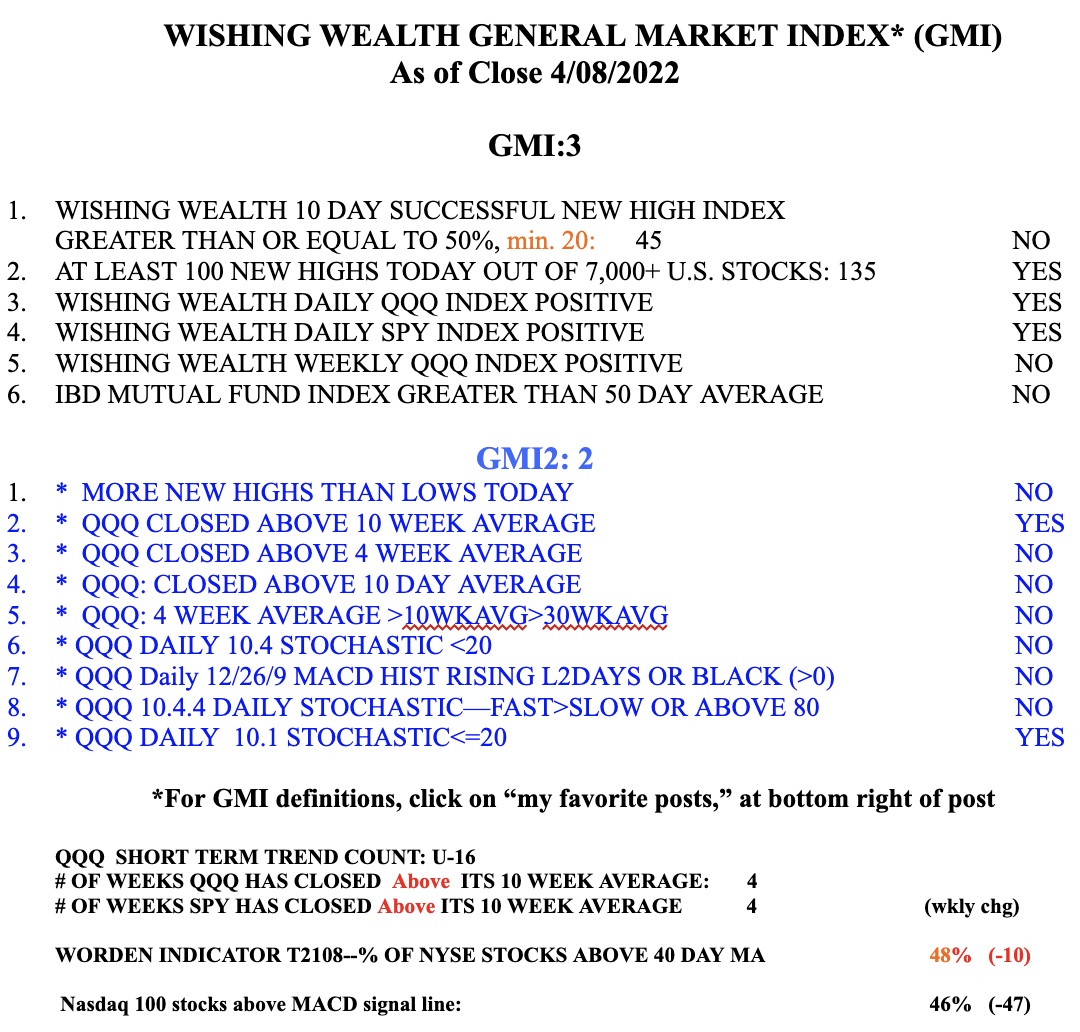
The GMI remains on a Red signal, reflecting largely the developing Stage 4 down-trend in QQQ. Everyone be careful.