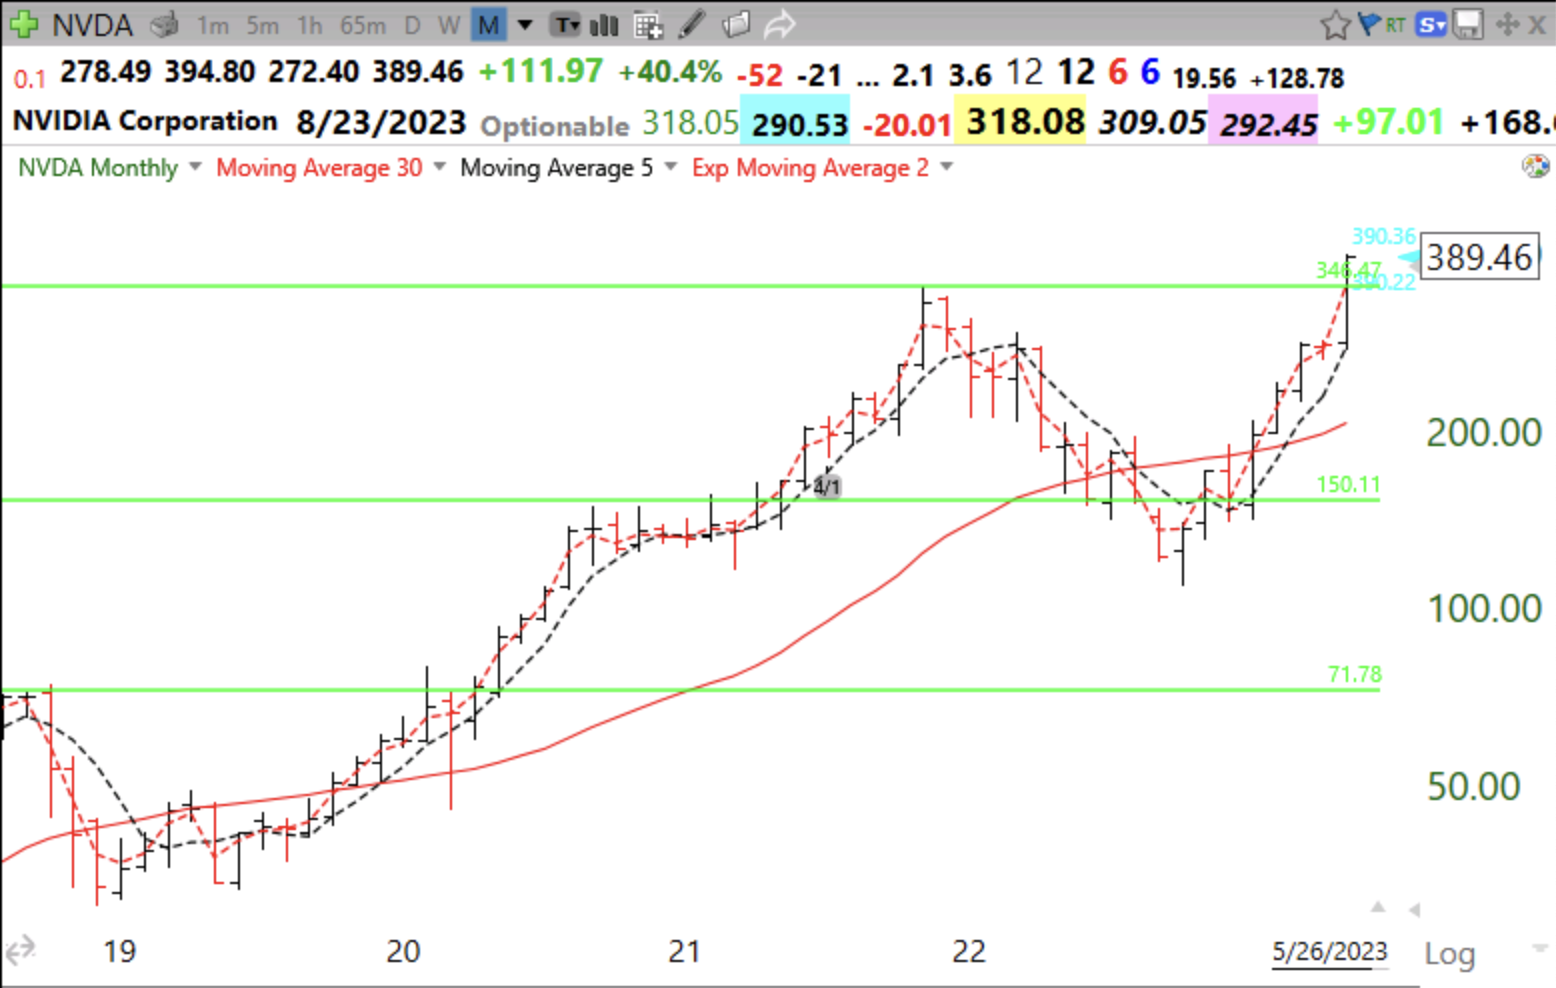
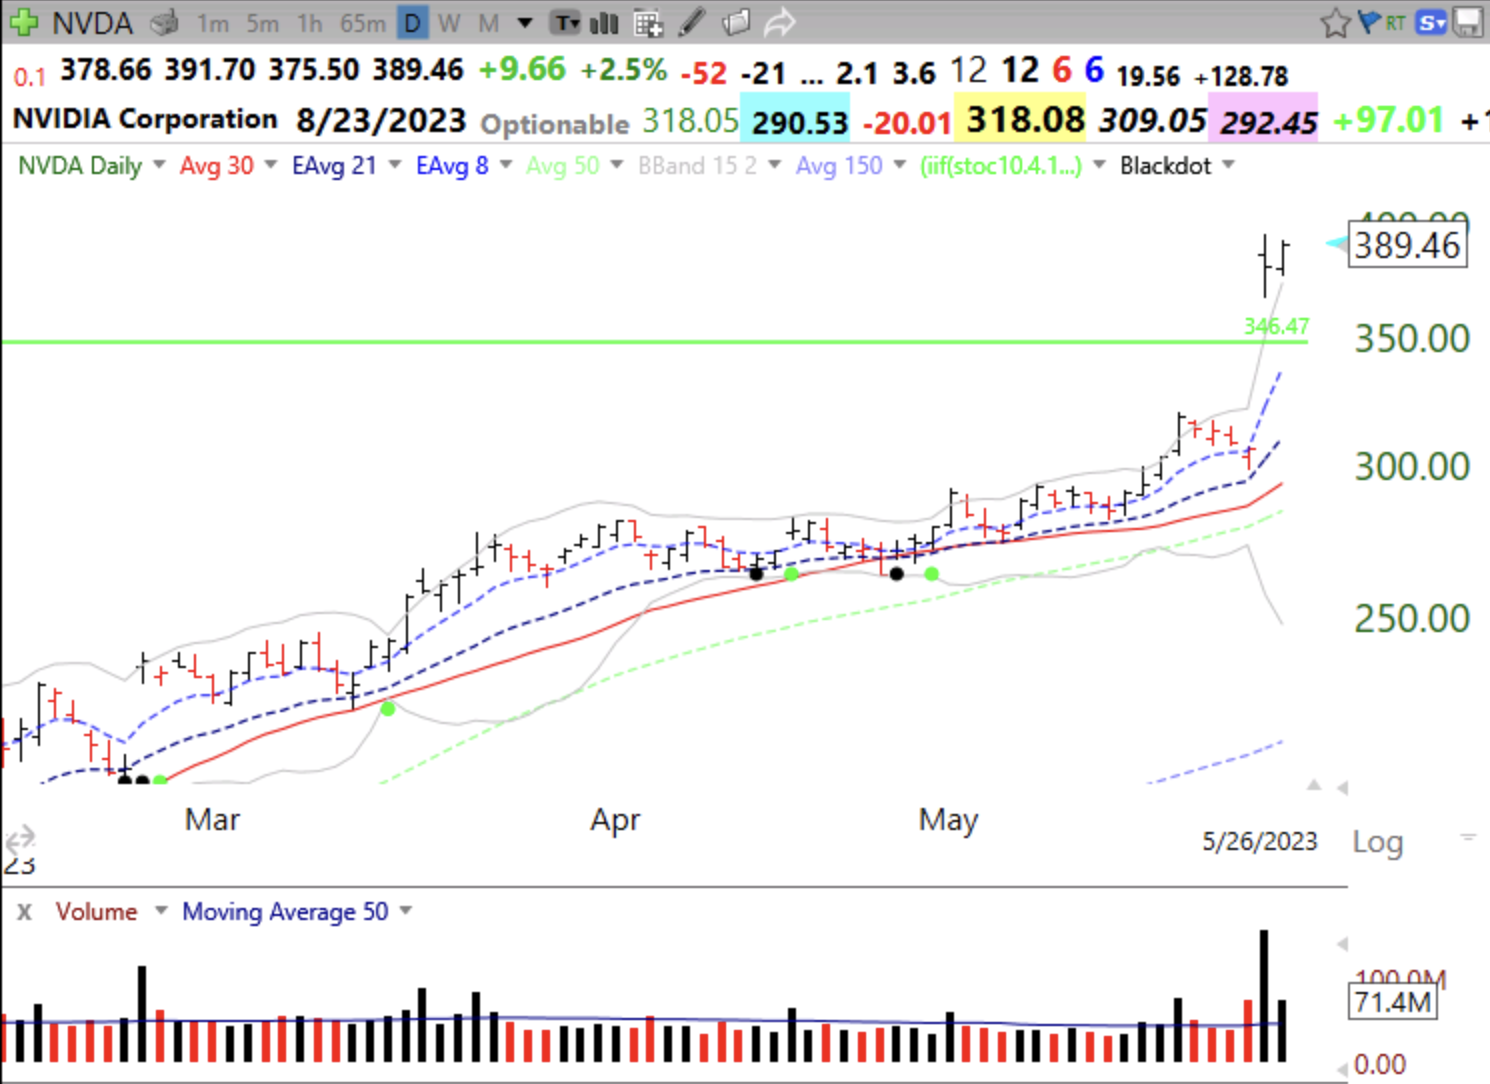
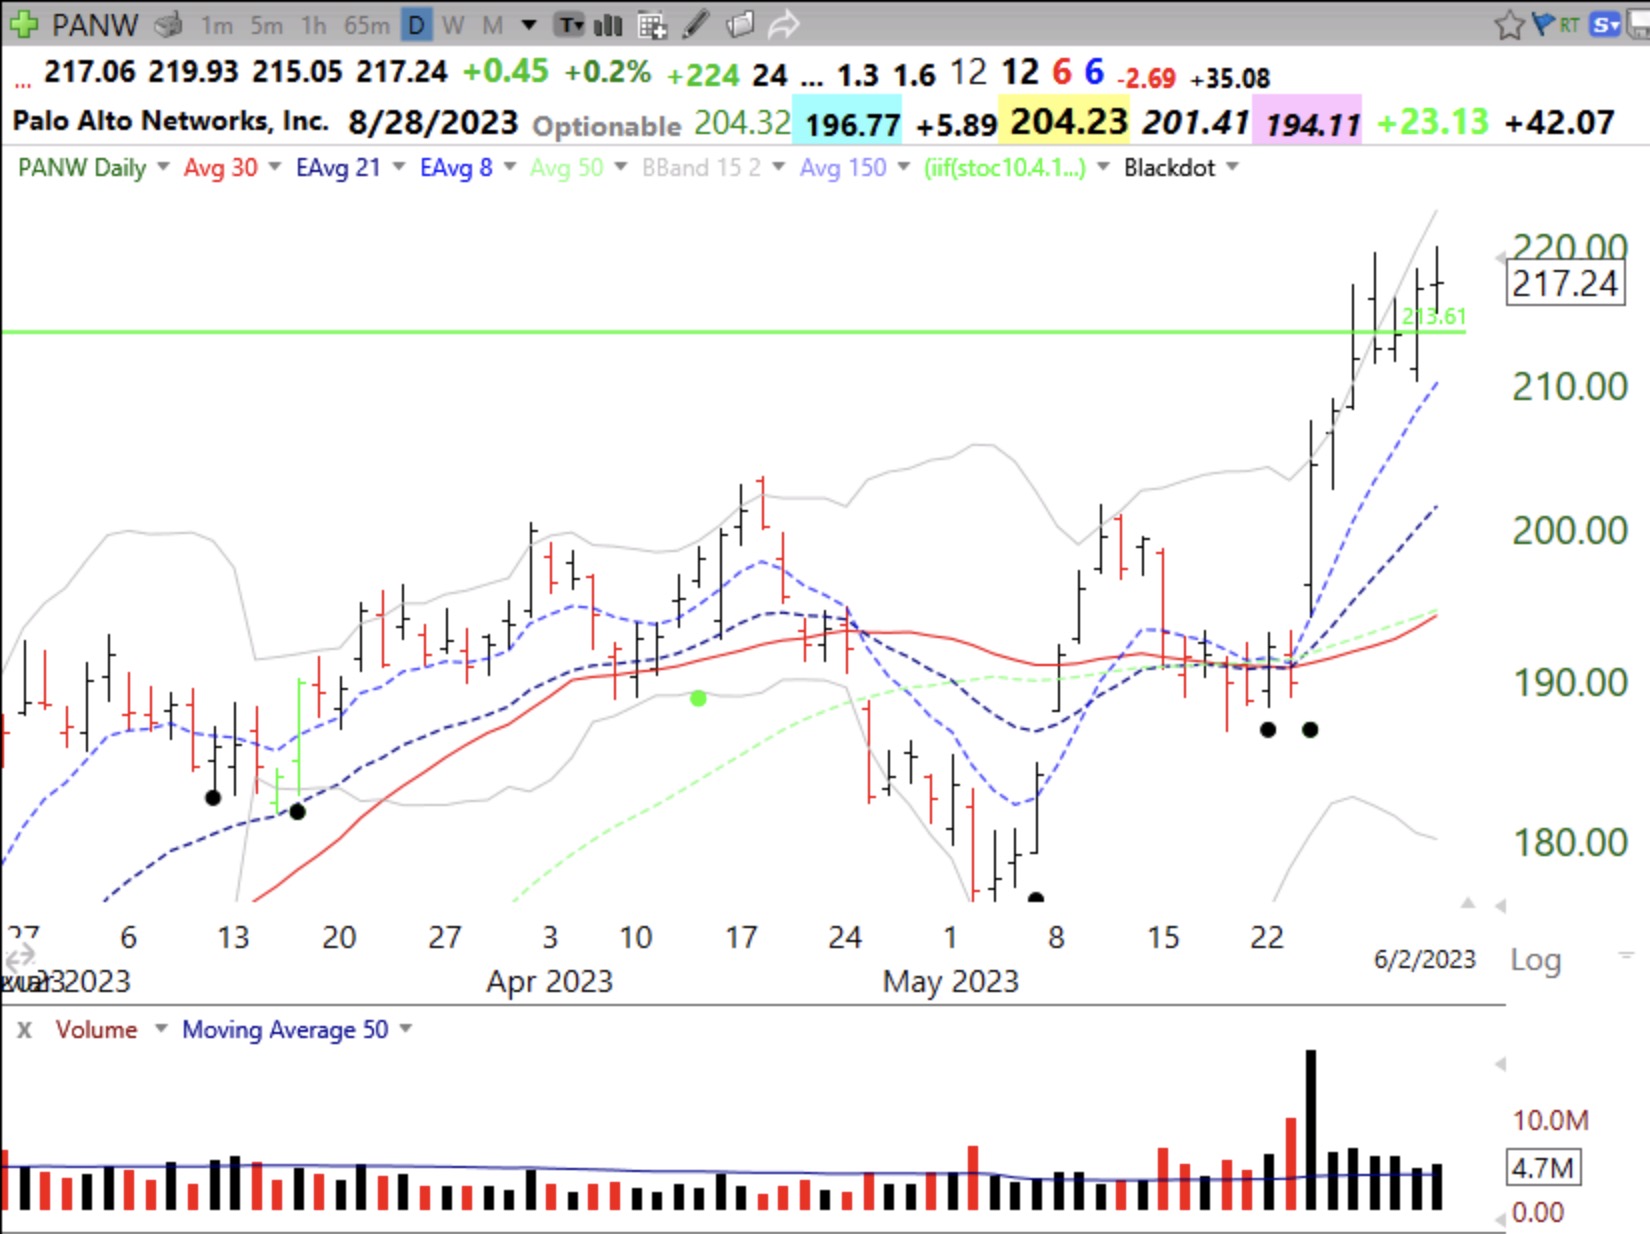
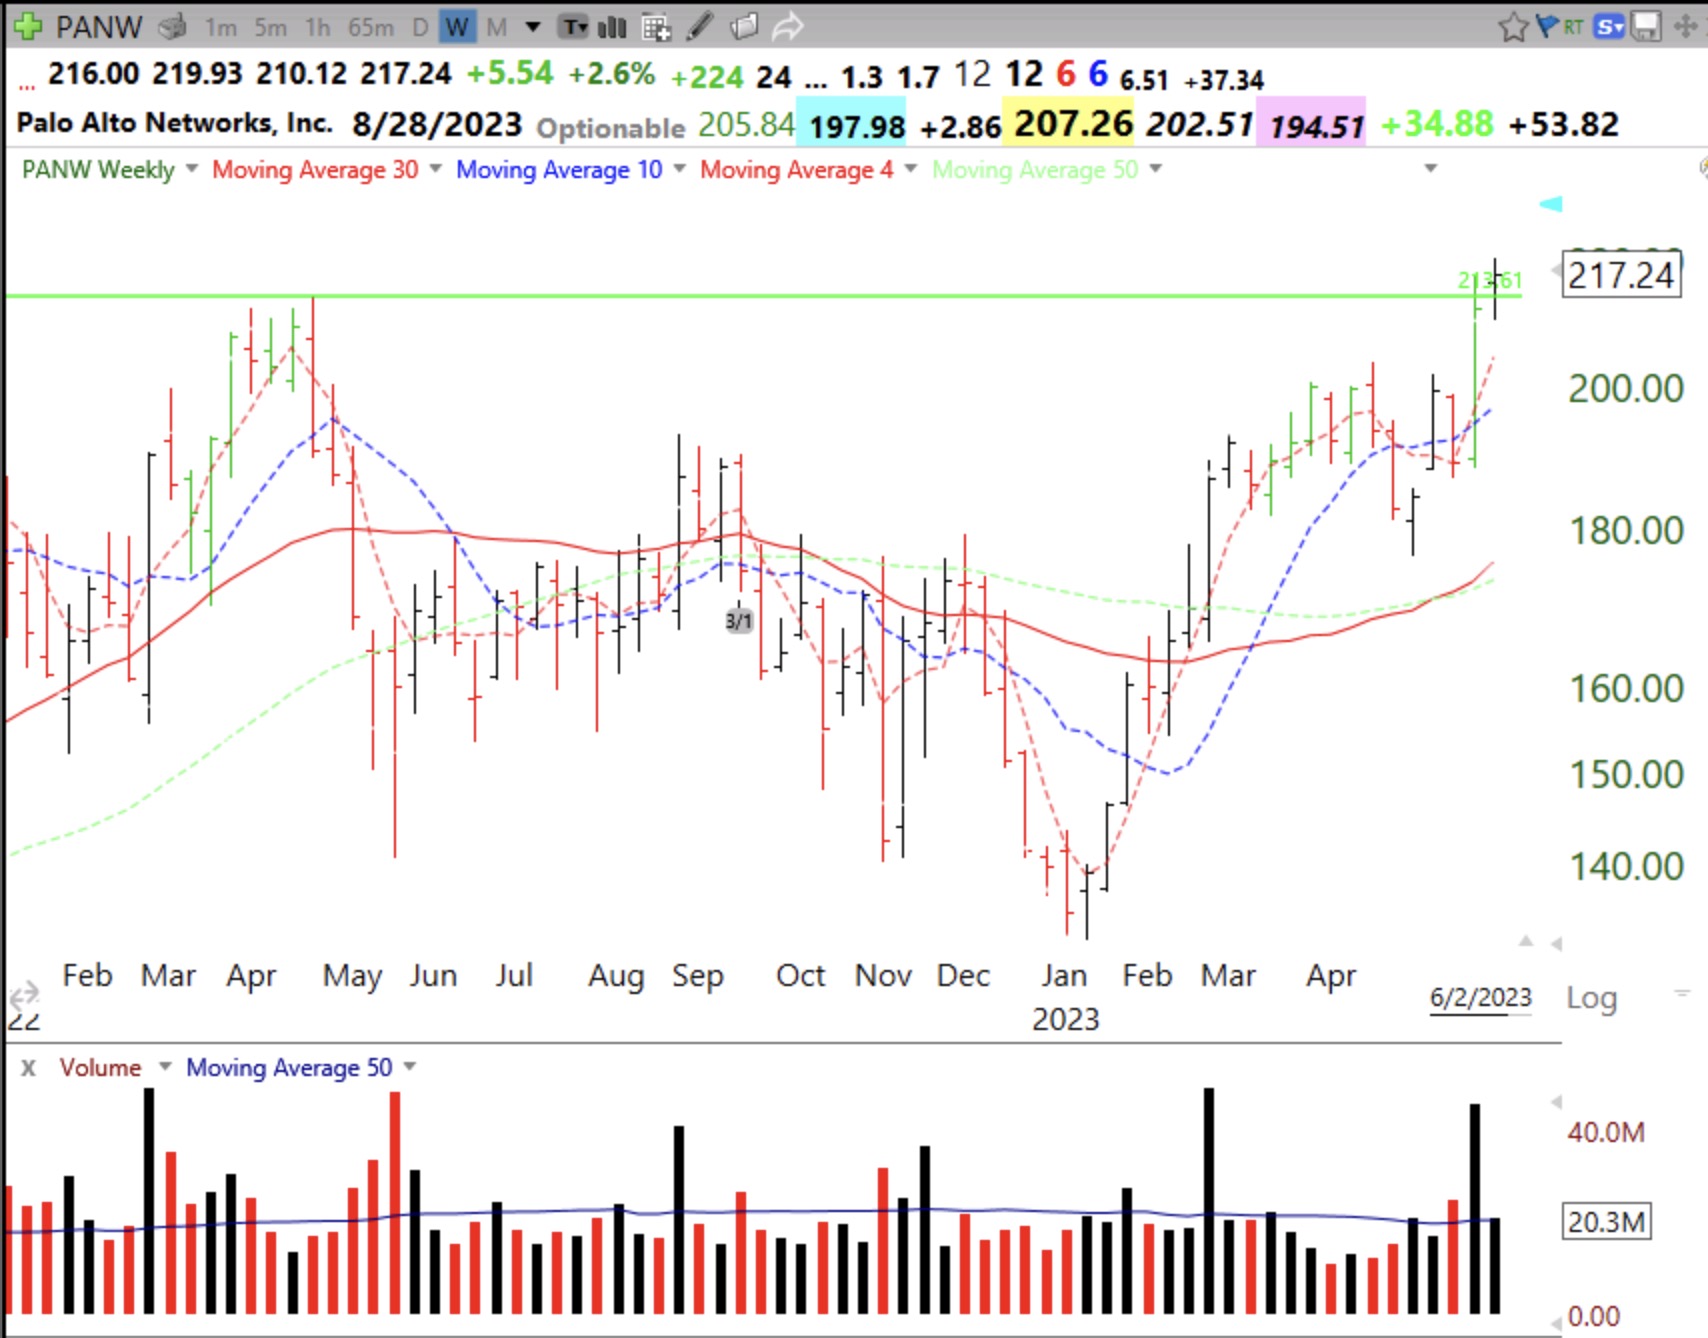
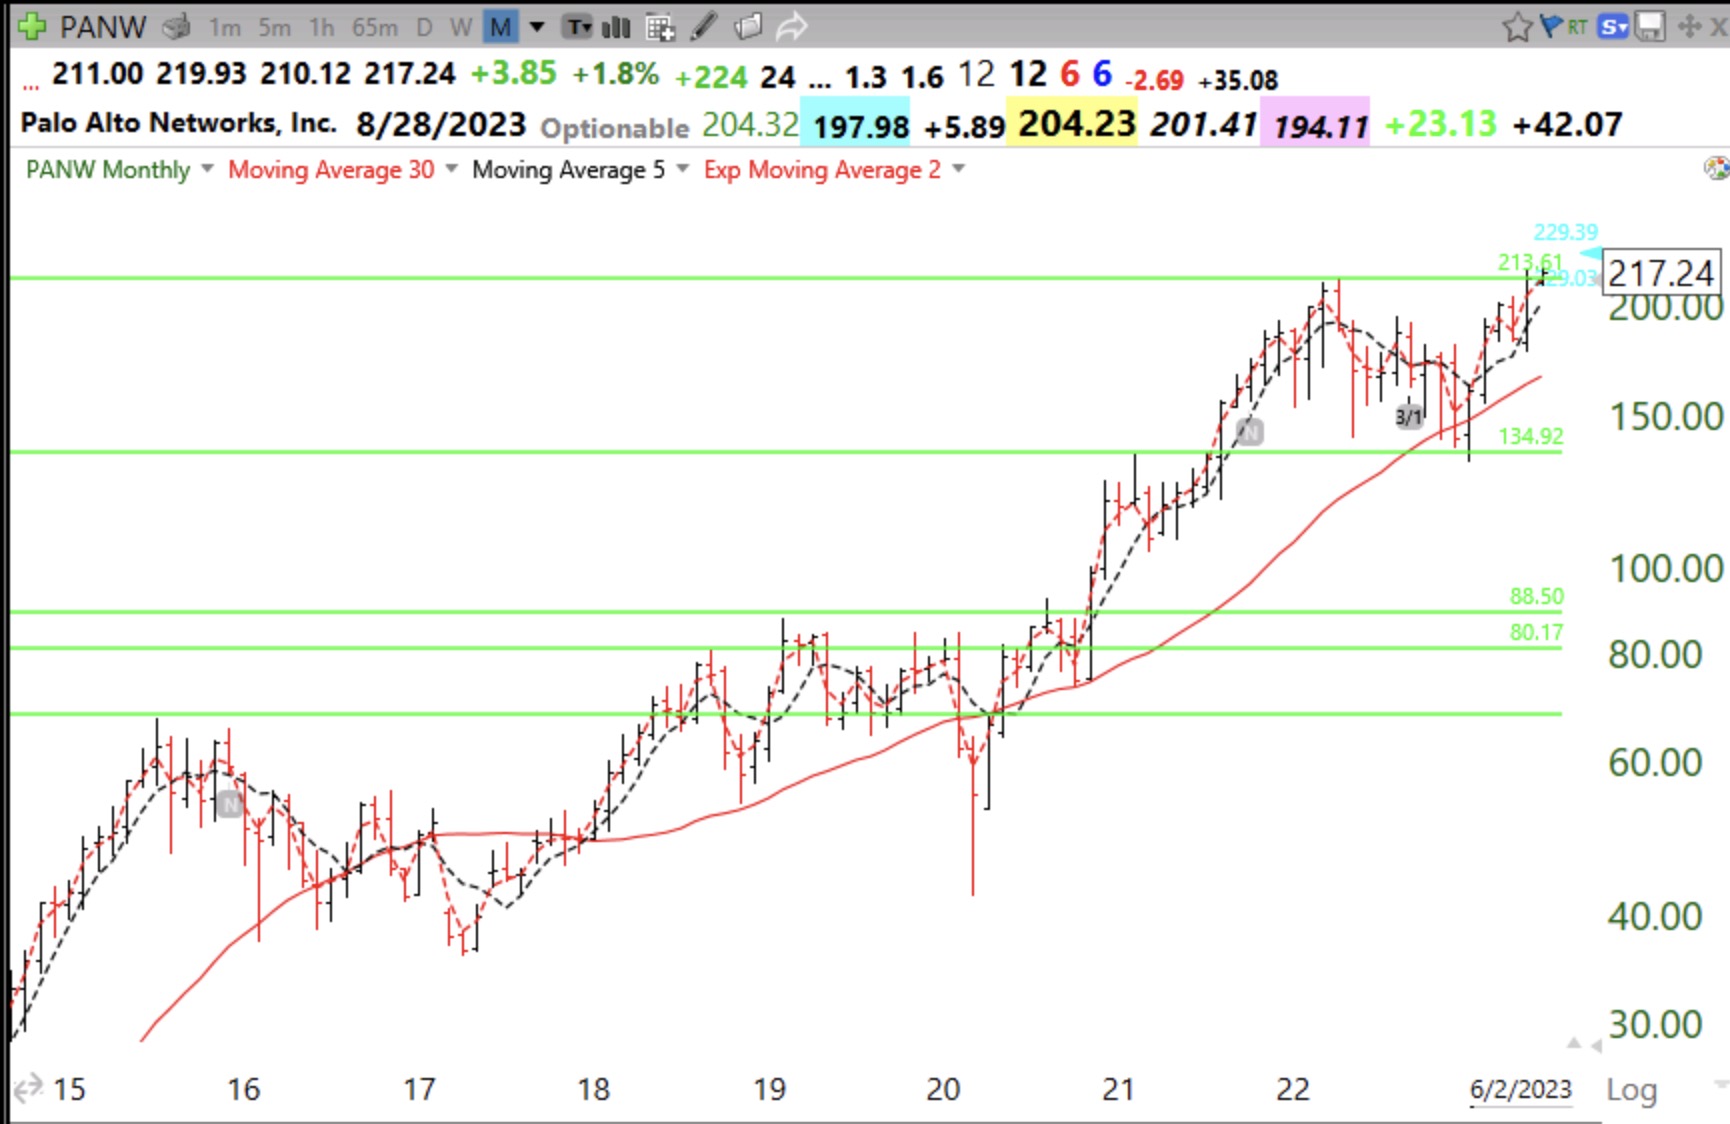
PANW kept coming up in my ATH scans. It had a GLB to a new ATH on May 26. It finally closed above its green line of $213.61 on Thursday, June 1. I bought some on Friday. Friday evening it was announced that PANW will be added to the S&P500 index and the stock has taken off during the after market. Funds and ETFs that mimic the S&P500 index must now buy PANW. My reason for illustrating this trade is to let you know that a stock’s strong behavior often occurs before the news is out. Insiders may have been buying PANW prior to the announcement and their buying caused the stock to have a green line breakout, GLB, to an ATH. The huge up volume day was after recent earnings were released. When an earnings release is followed by a large gap up it can be the beginning of a significant move up. Nicolas Darvas wrote years ago that the atypical volume in a rising stock often enabled him to get on board with the insiders who knew good news was coming. A stock’s and the market’s behaviors are the things to watch. Here are the daily, weekly and monthly charts for PANW. On the monthly you can see all of the green lines drawn in. I draw a green line on a monthly chart at the highest bar that is not exceeded for at least 3 more bars (3 months). I am looking for stocks that reach an ATH, rest for at least 3 months and then break out (GLB) to close above their former peak price.
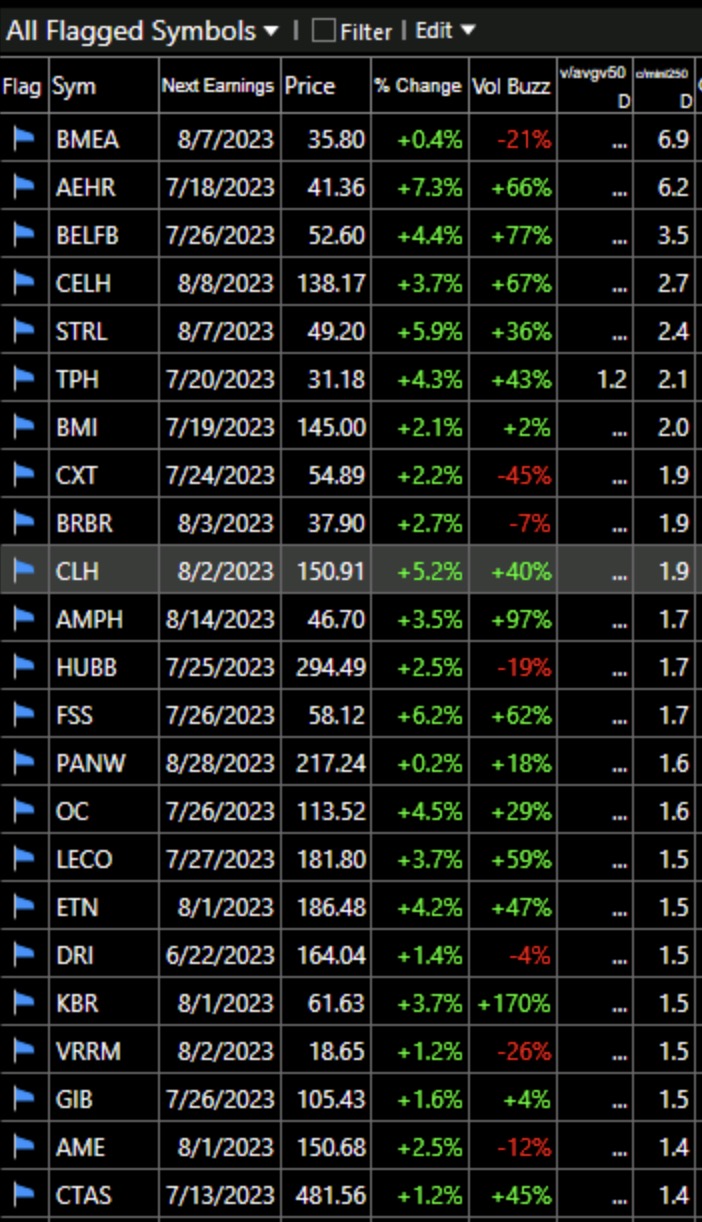
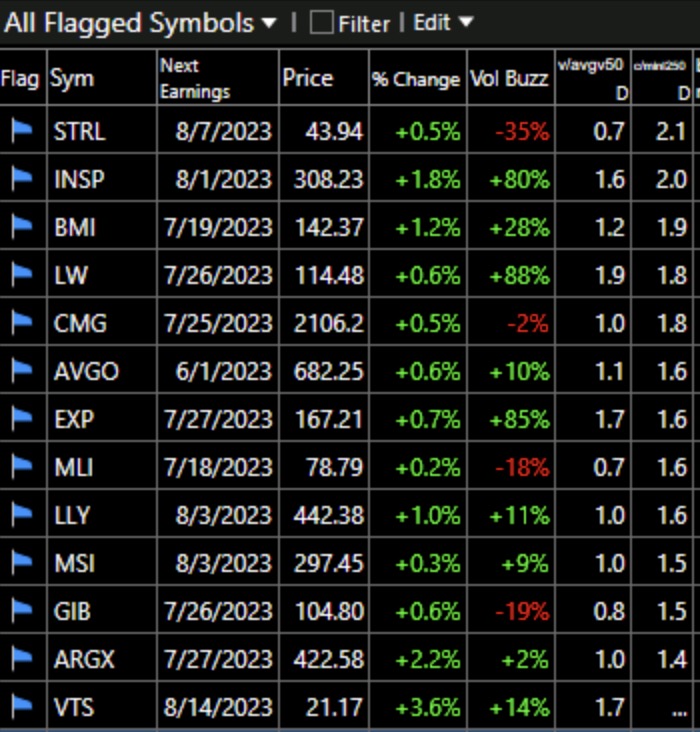
I have written that I am reinvesting in the market. My trend indicators are strong and many stocks are moving up. Here are 23 stocks on my recent IBD/MS lists that reached an ATH on Friday. They are sorted by the last column, which shows the close Friday/lowest close the past 250 days. Seven have already doubled their yearly lows. I own a few of these stocks.