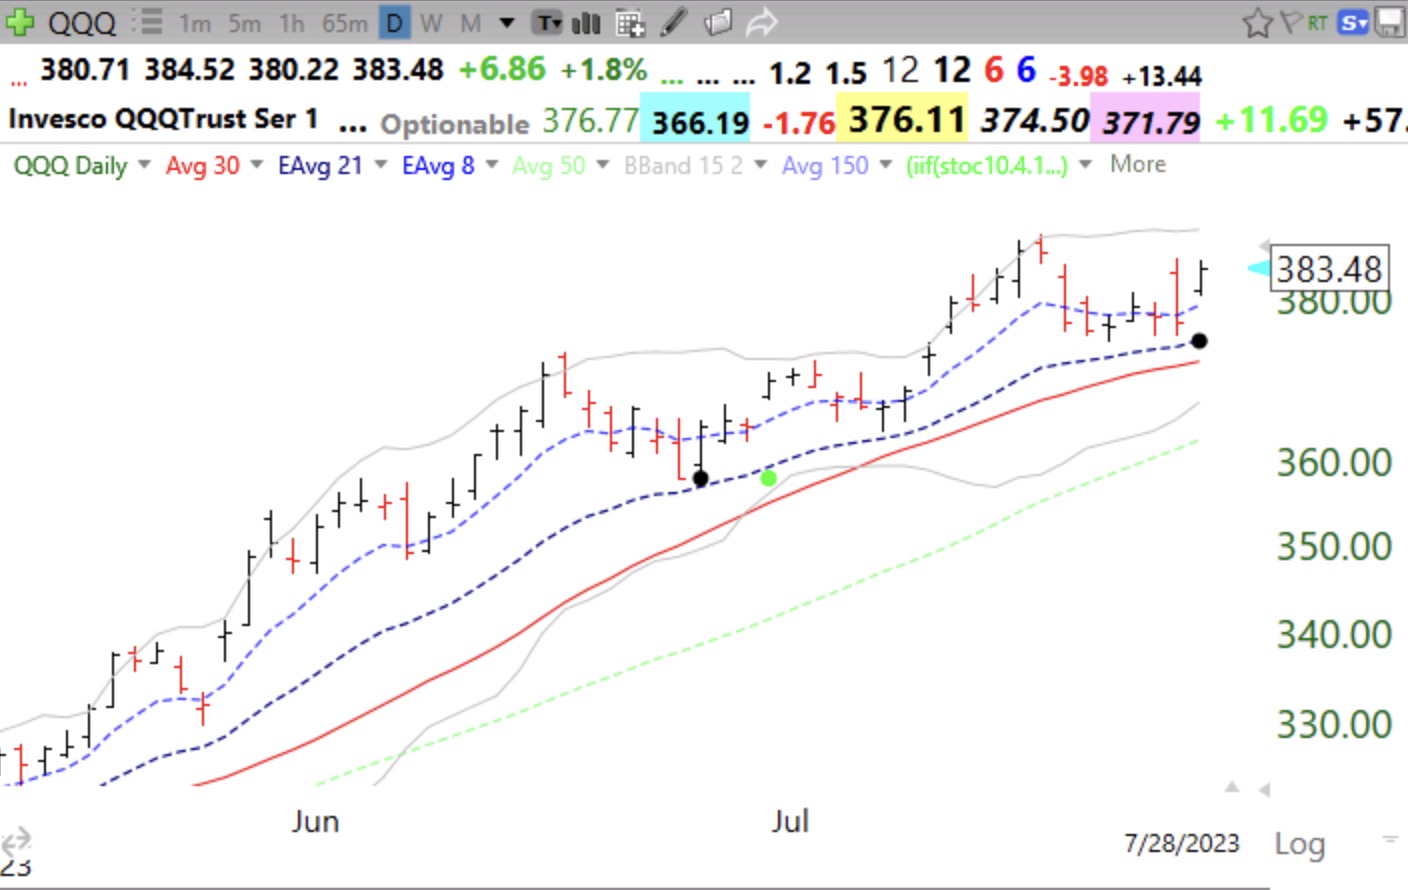
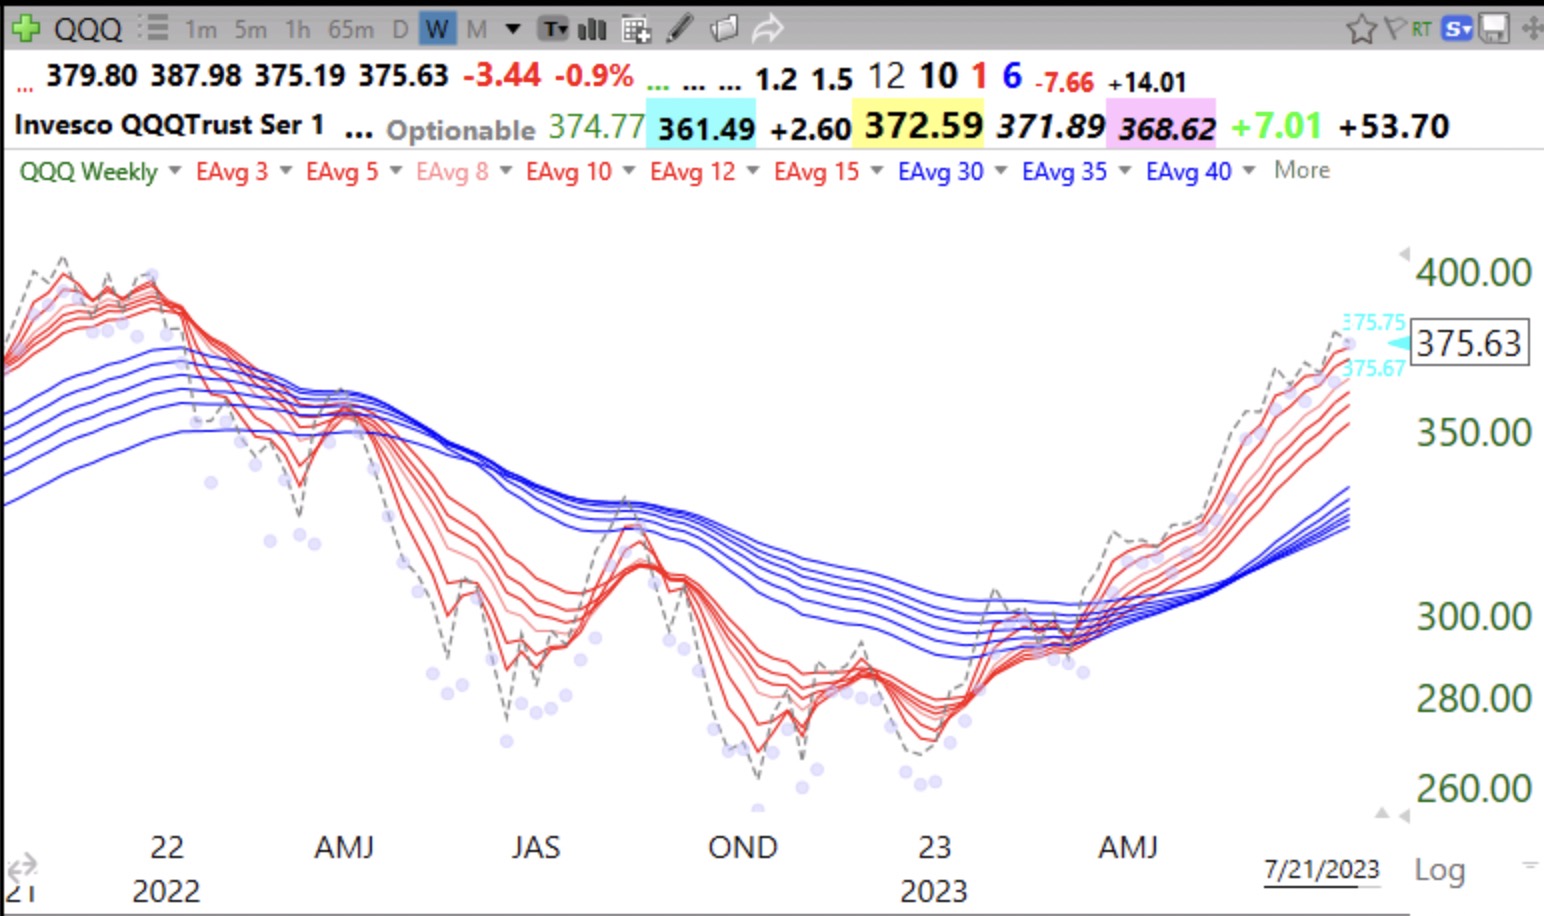
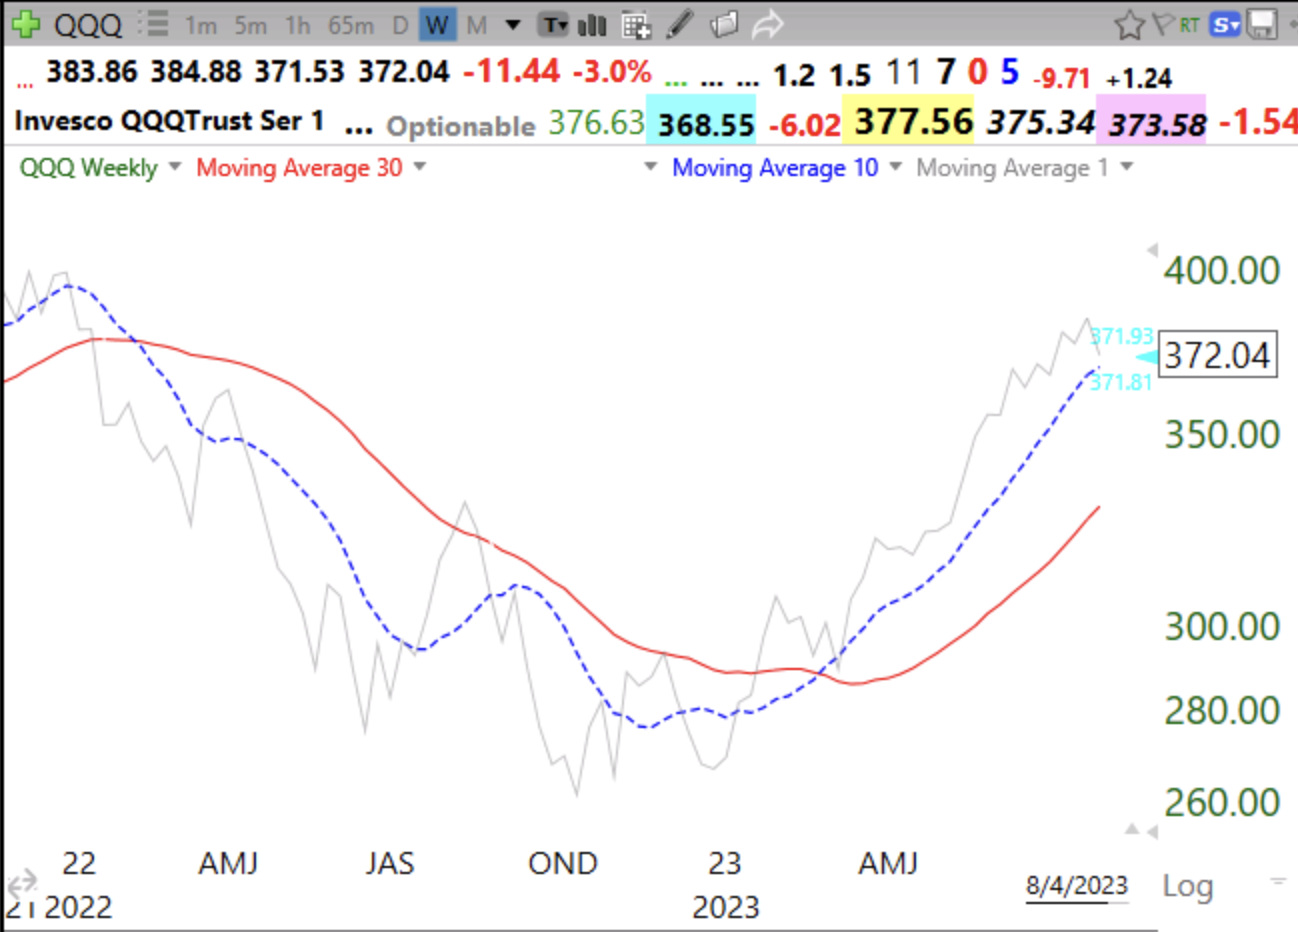
Another flat or down day for QQQ on Monday will end the QQQ short term up-trend after 68 days. But about 40% of QQQ short term down trends end in 5 days or less and QQQ’s longer term trend remains up. This 10:30 weekly chart shows that QQQ is in a strong longer term up-trend with the 10 week average rising above the rising 30 week average for its 23rd week. I would become more defensive if the weekly close (gray line) should decline below the 30 week average (red line).
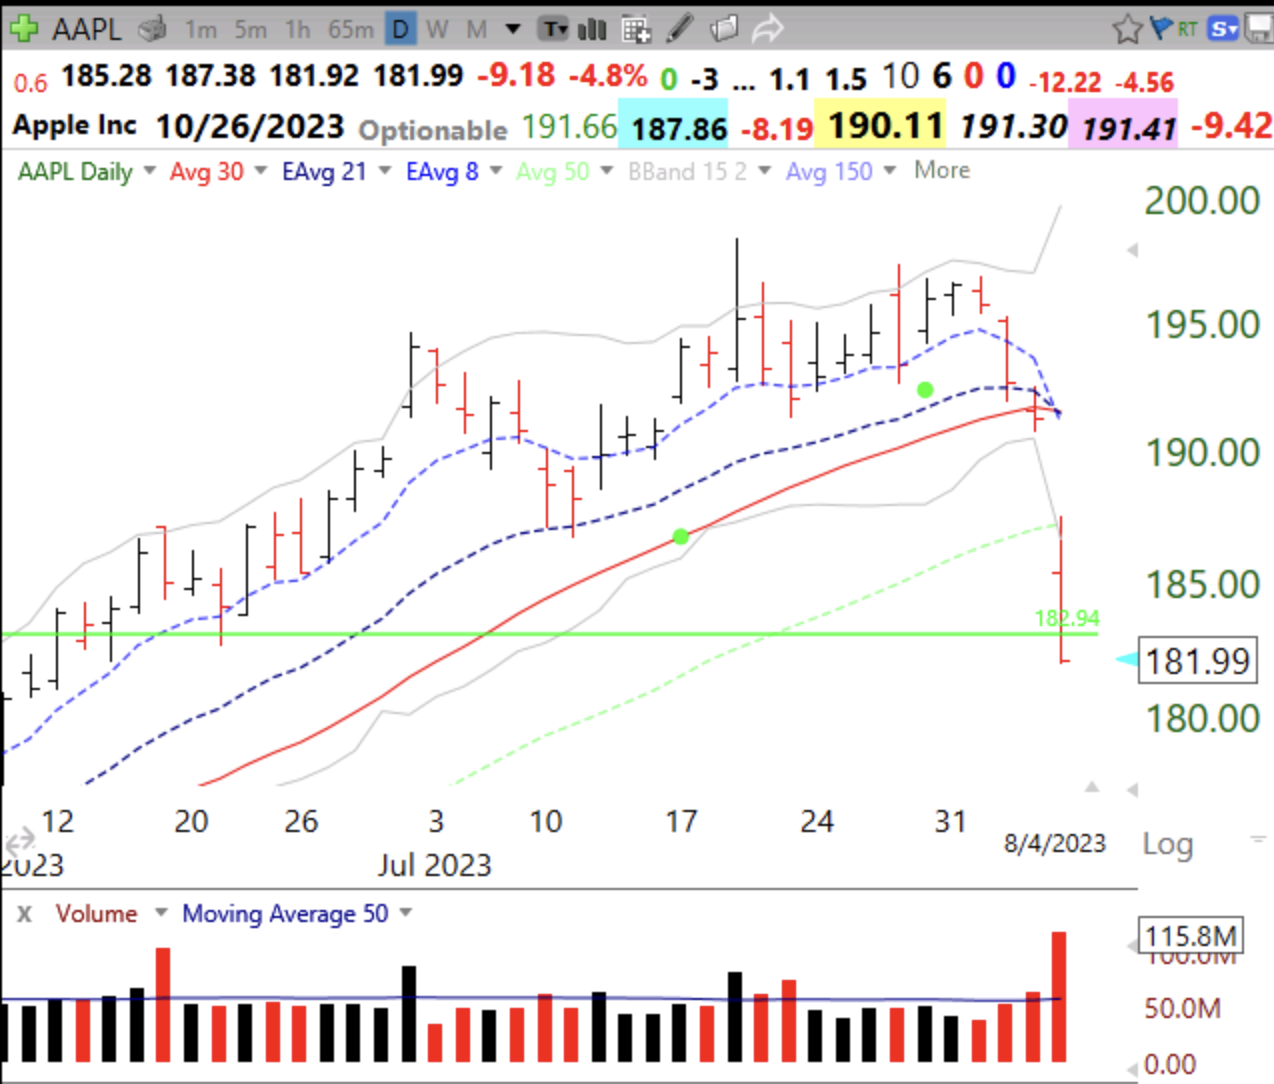
It is disconcerting that AAPL failed its GLB (green line break-out to ATH) on above average volume on Friday.
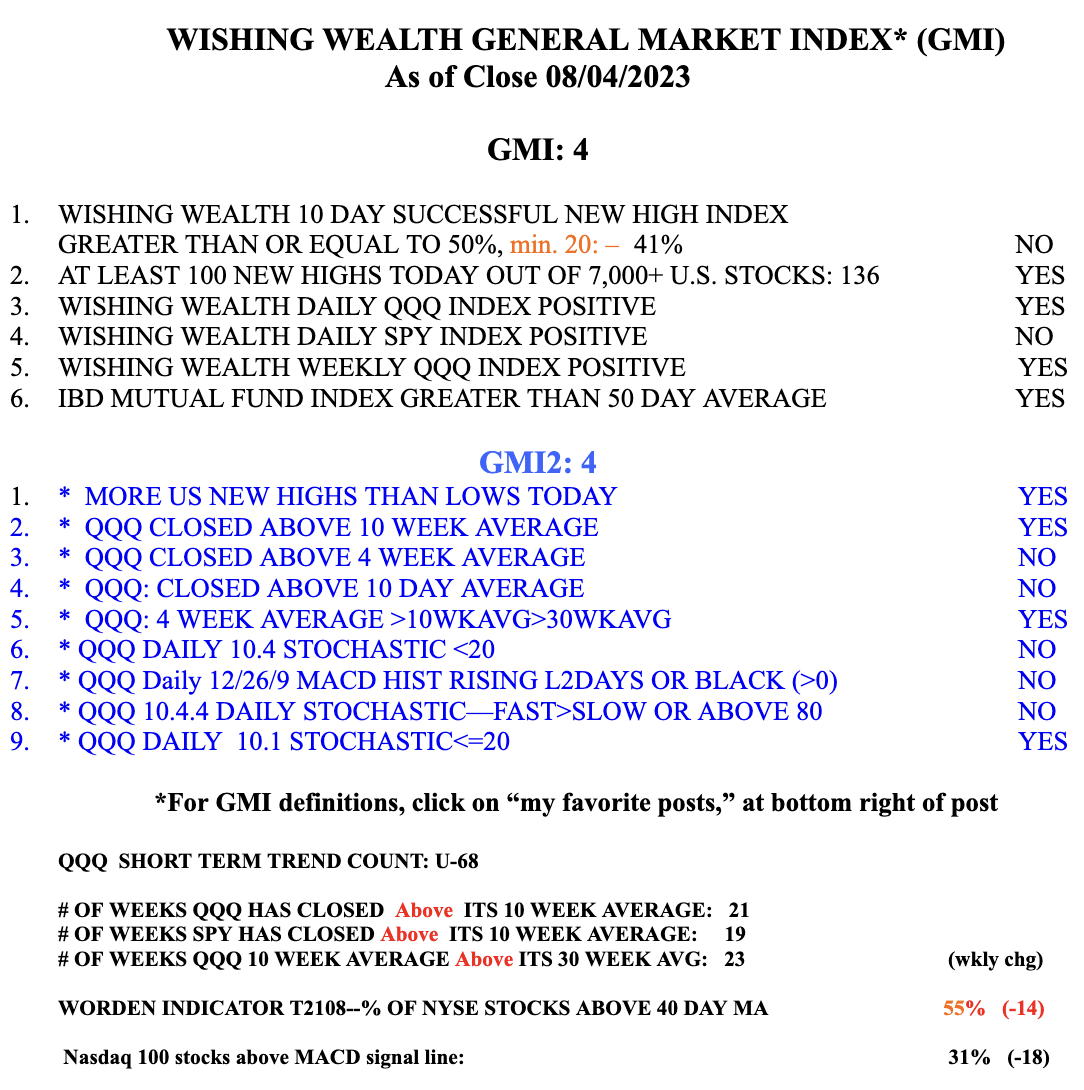
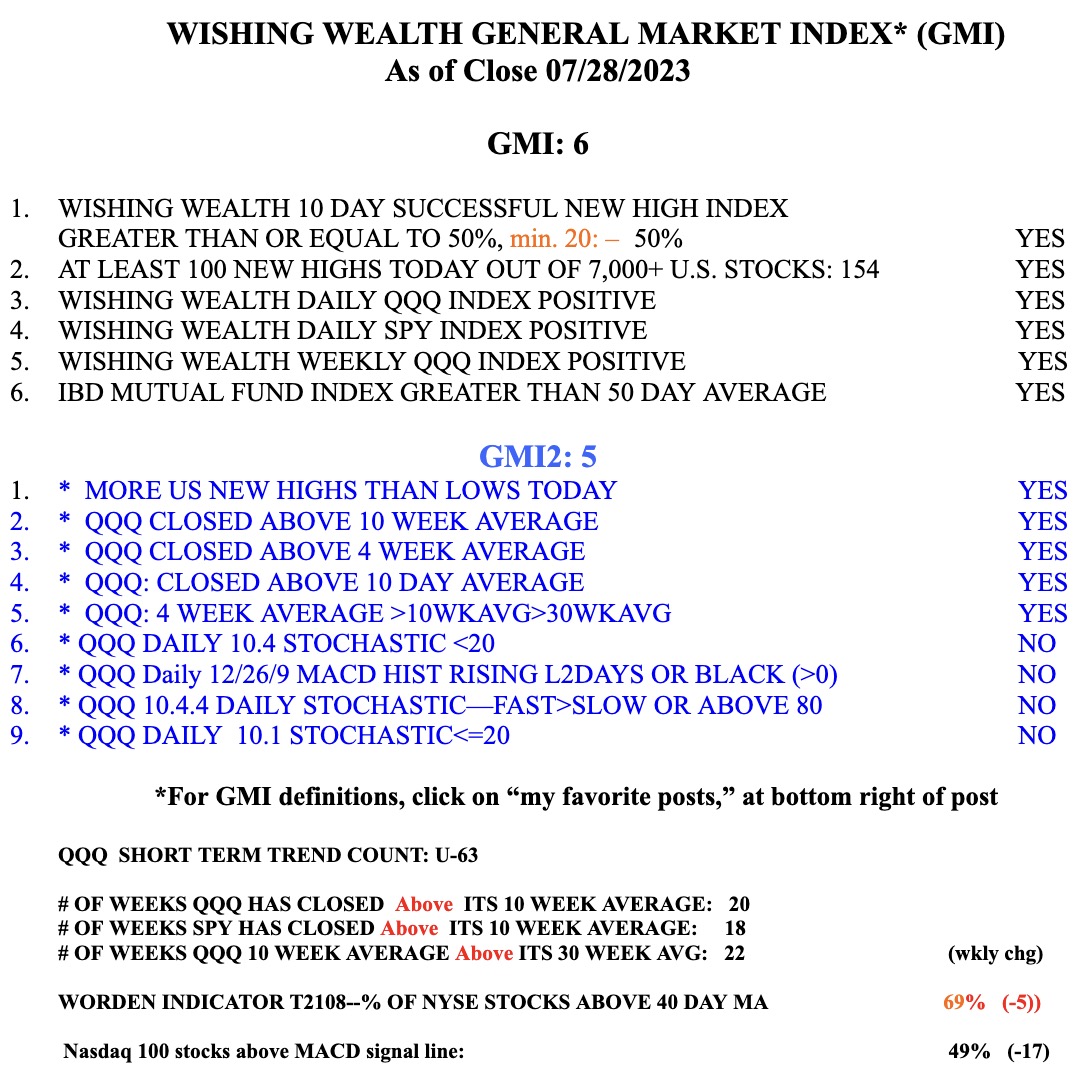
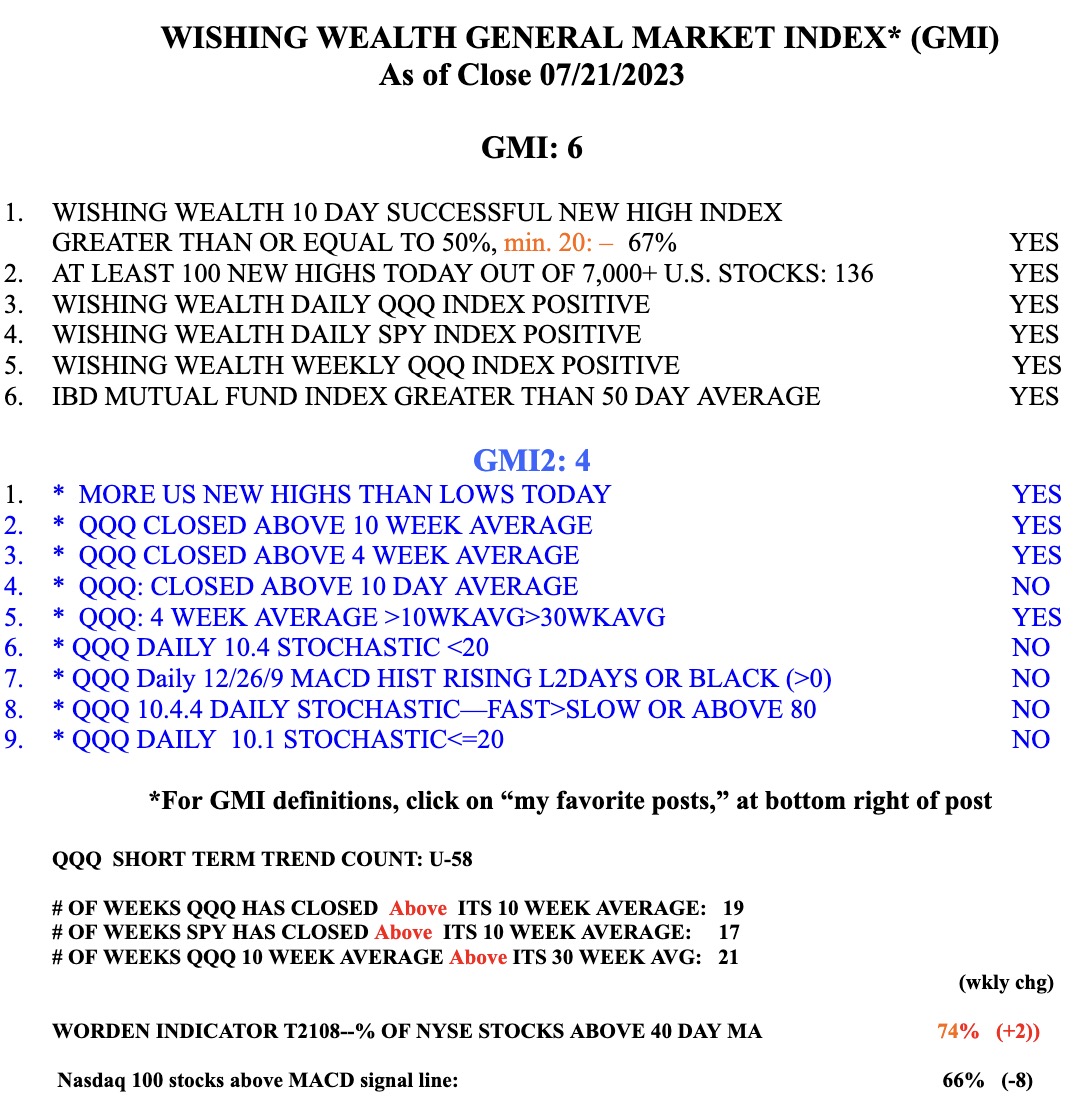
The GMI has now declined to 4 (of 6).