Blog Post: 25 new US highs and 588 new lows on Friday, down from 888 on Thursday; $SPY heading down to trend channel line I drew months ago? See weekly chart

GMI1/6
GMI-22/9
T210813%

I drew this lower trend channel line (thank you Vas!) months ago and suggested that SPY may decline to hit it again, right at the last green line break-out. This is a weekly chart. Note the blue arrow in the volume section. That high volume decline was one of the factors that got me out of the market at the end of last year. Another factor was the growing number of new daily lows occurring even as the index was still climbing.


The GMI remains on a Red signal and I am in cash.

Blog Post: Market stats are similar to what occurred at June low: 1,374 new yearly US lows vs. 1,394 at June low, 81 Nasdaq 100 stocks with oversold daily 10.4 stochastics vs 85; T2108 = 12 now vs 11; P/C ratio= 1.08 vs. 1.17, but reached a more extreme 1.27 days before June bottom, see charts for trend

GMI0/6
GMI-22/9
T210812%

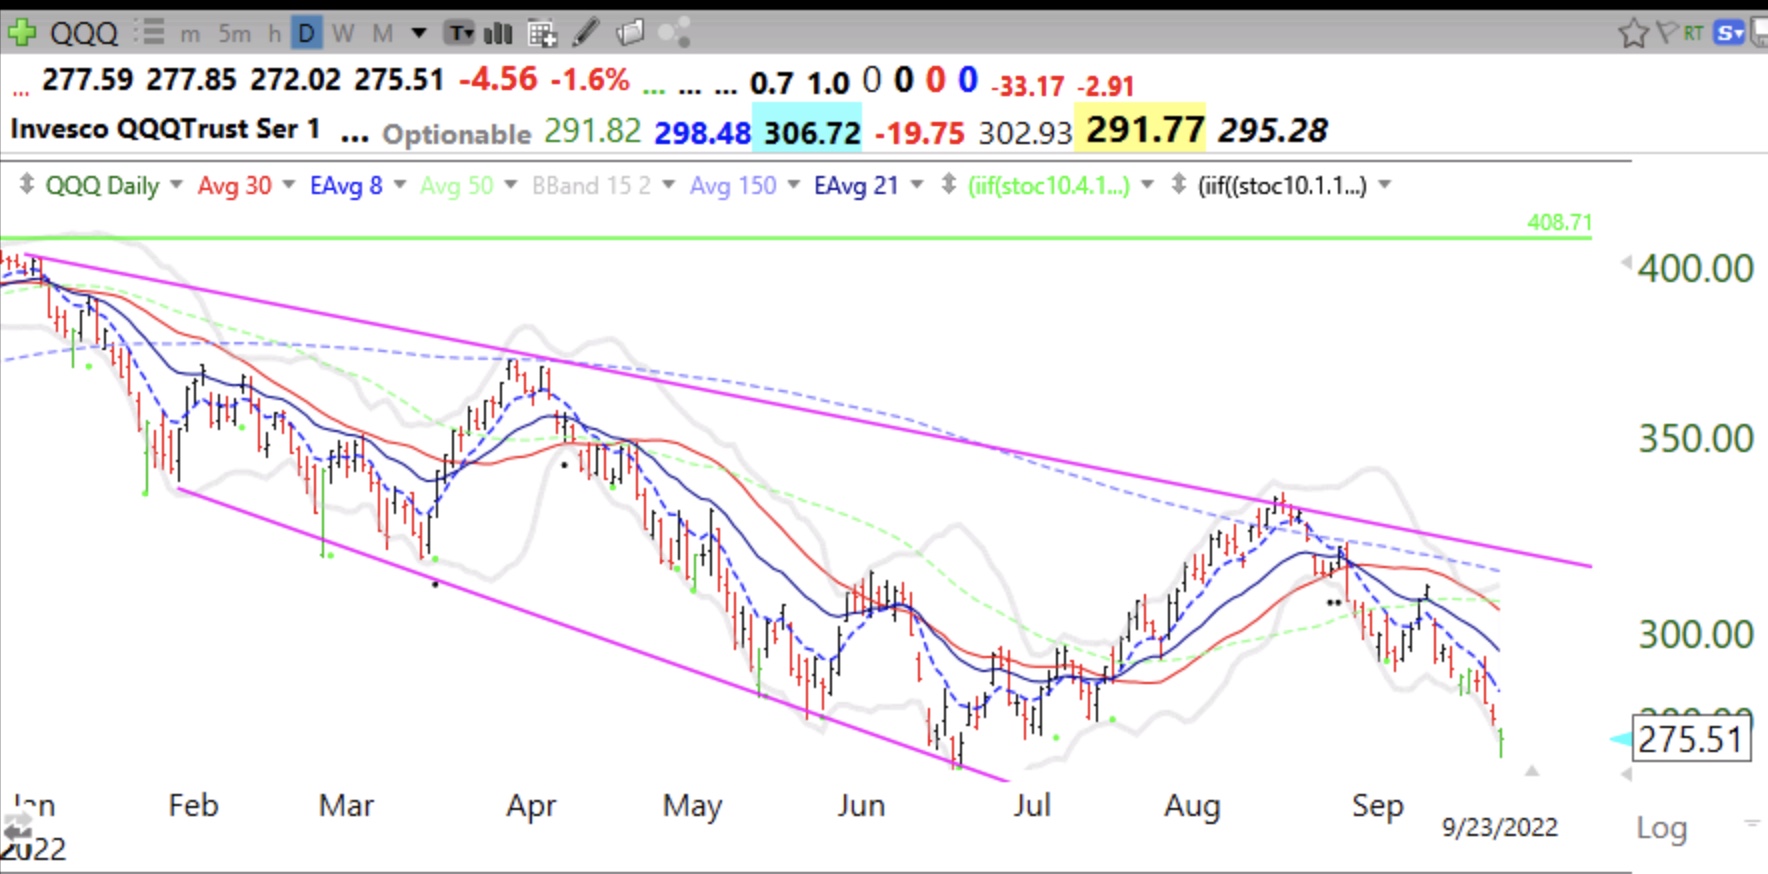
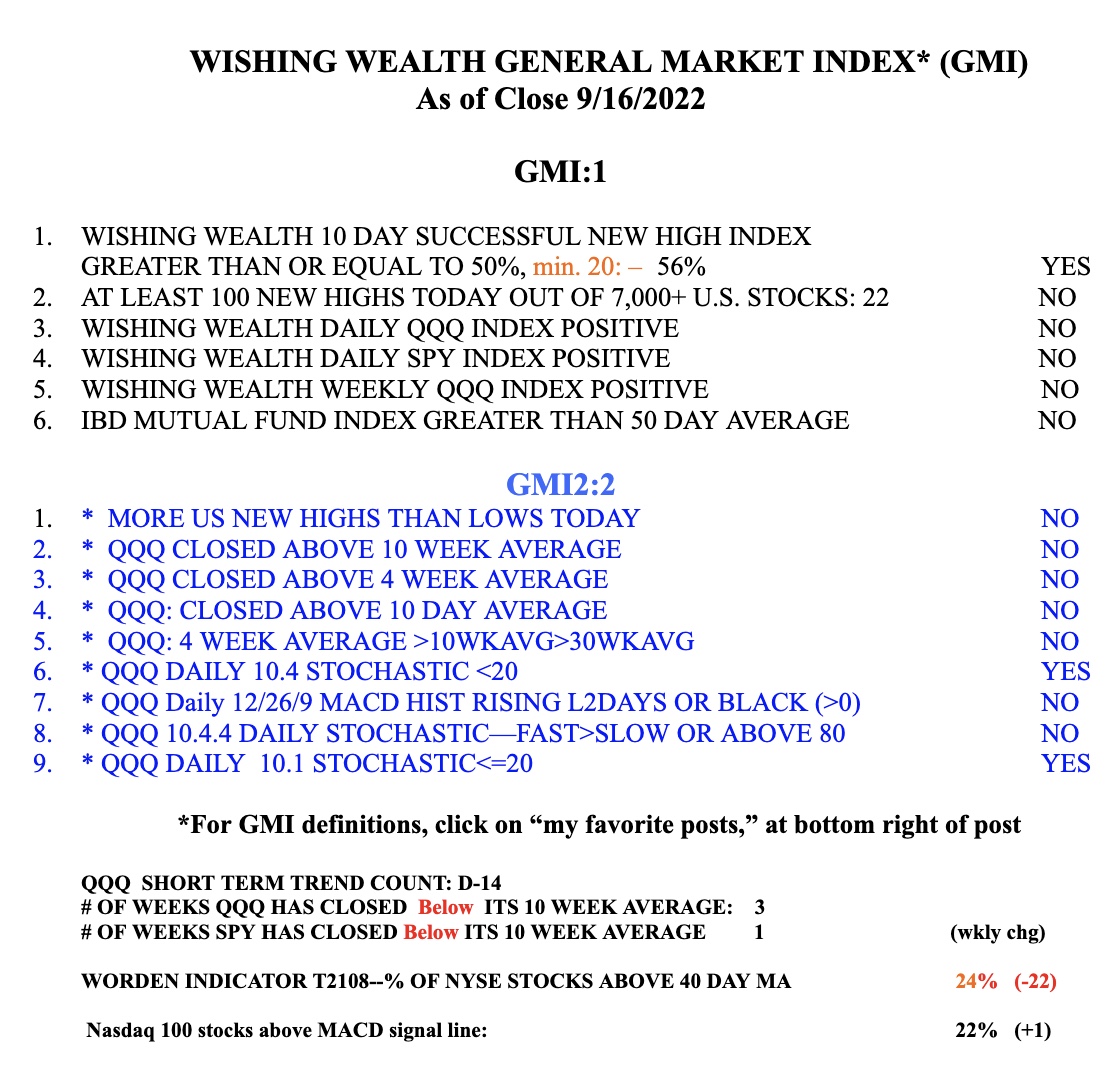
Friday’s indicators are very close to what occurred last June 16 when the QQQ bottomed and began a large rally. Will we get another tradable rally or will QQQ decline to hit that lower trend channel line or something else? No one knows but stocks often bounce during earnings season. These charts reveal the trend. First the daily…

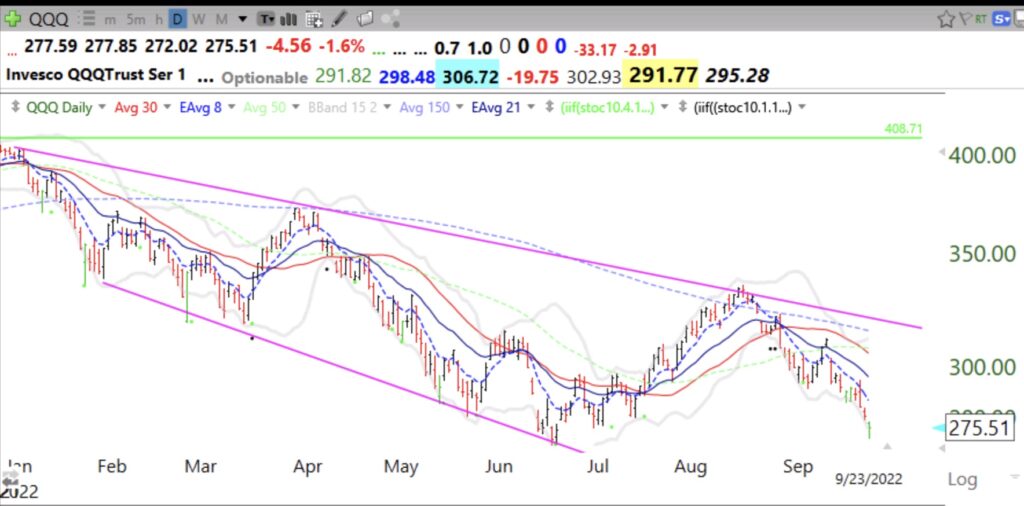
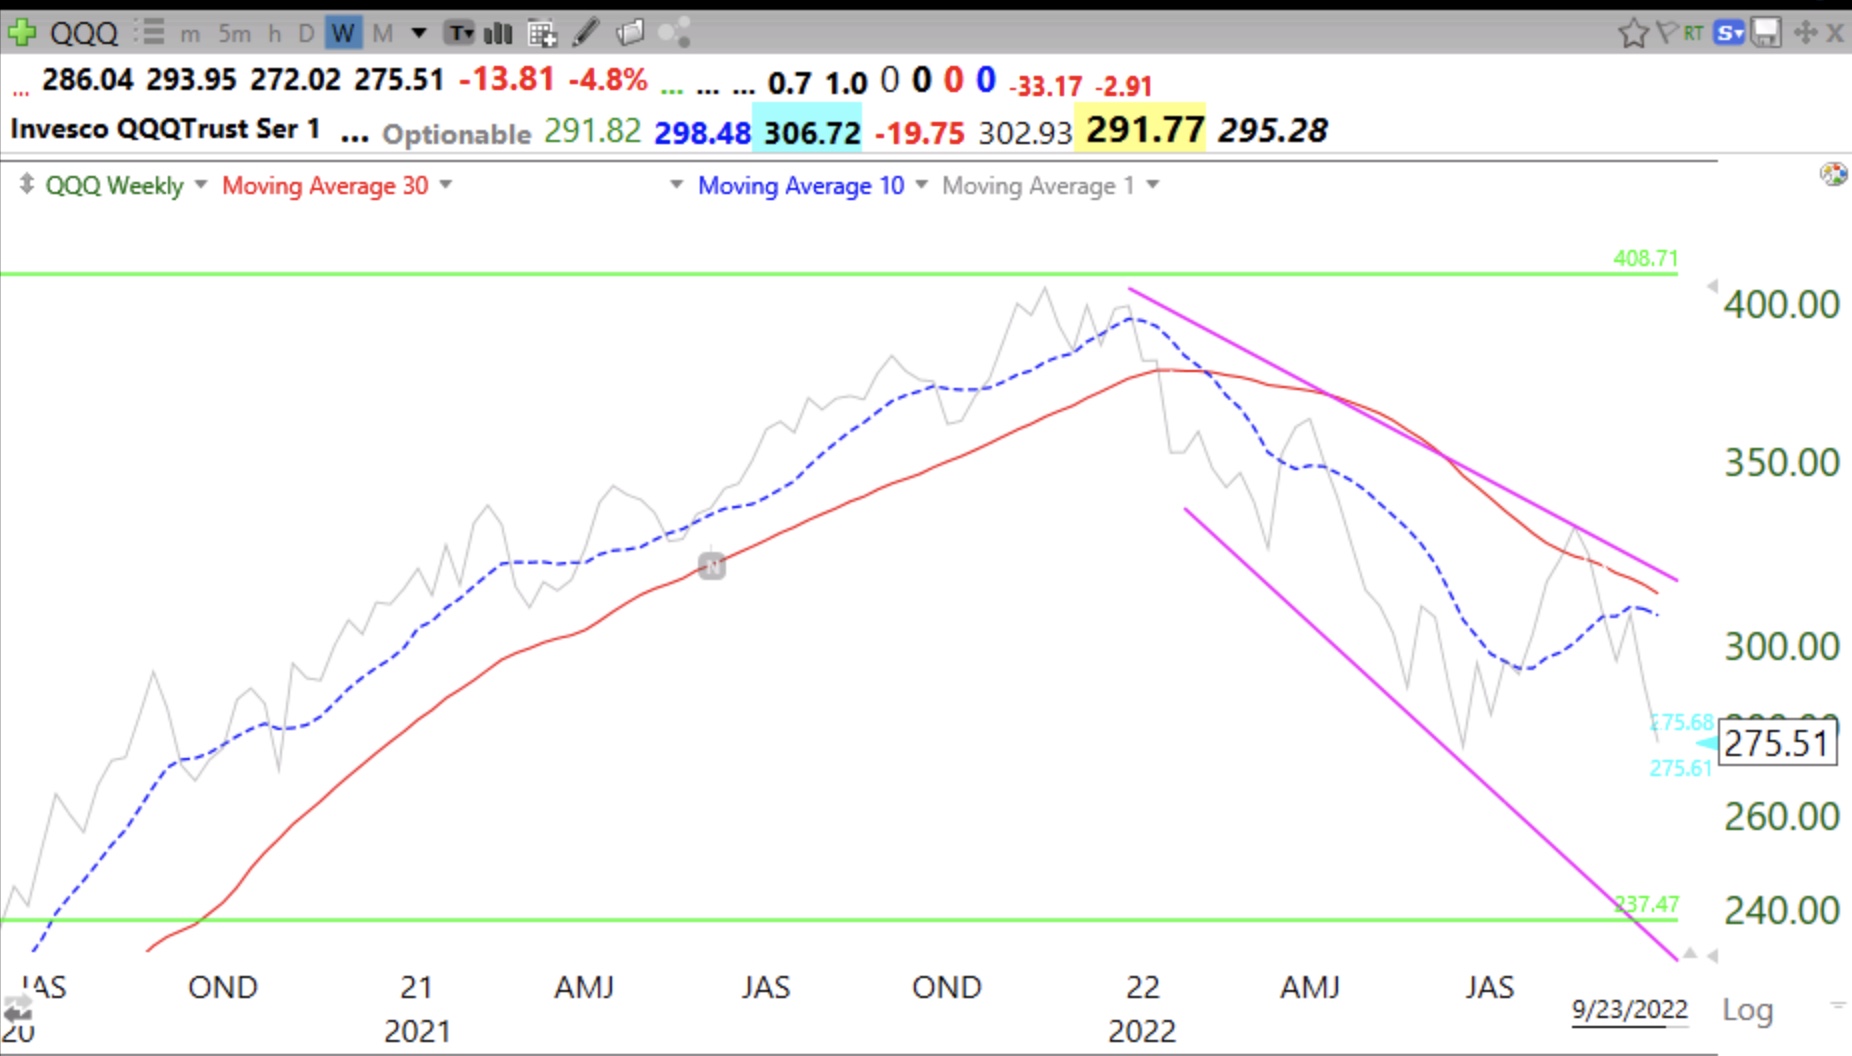
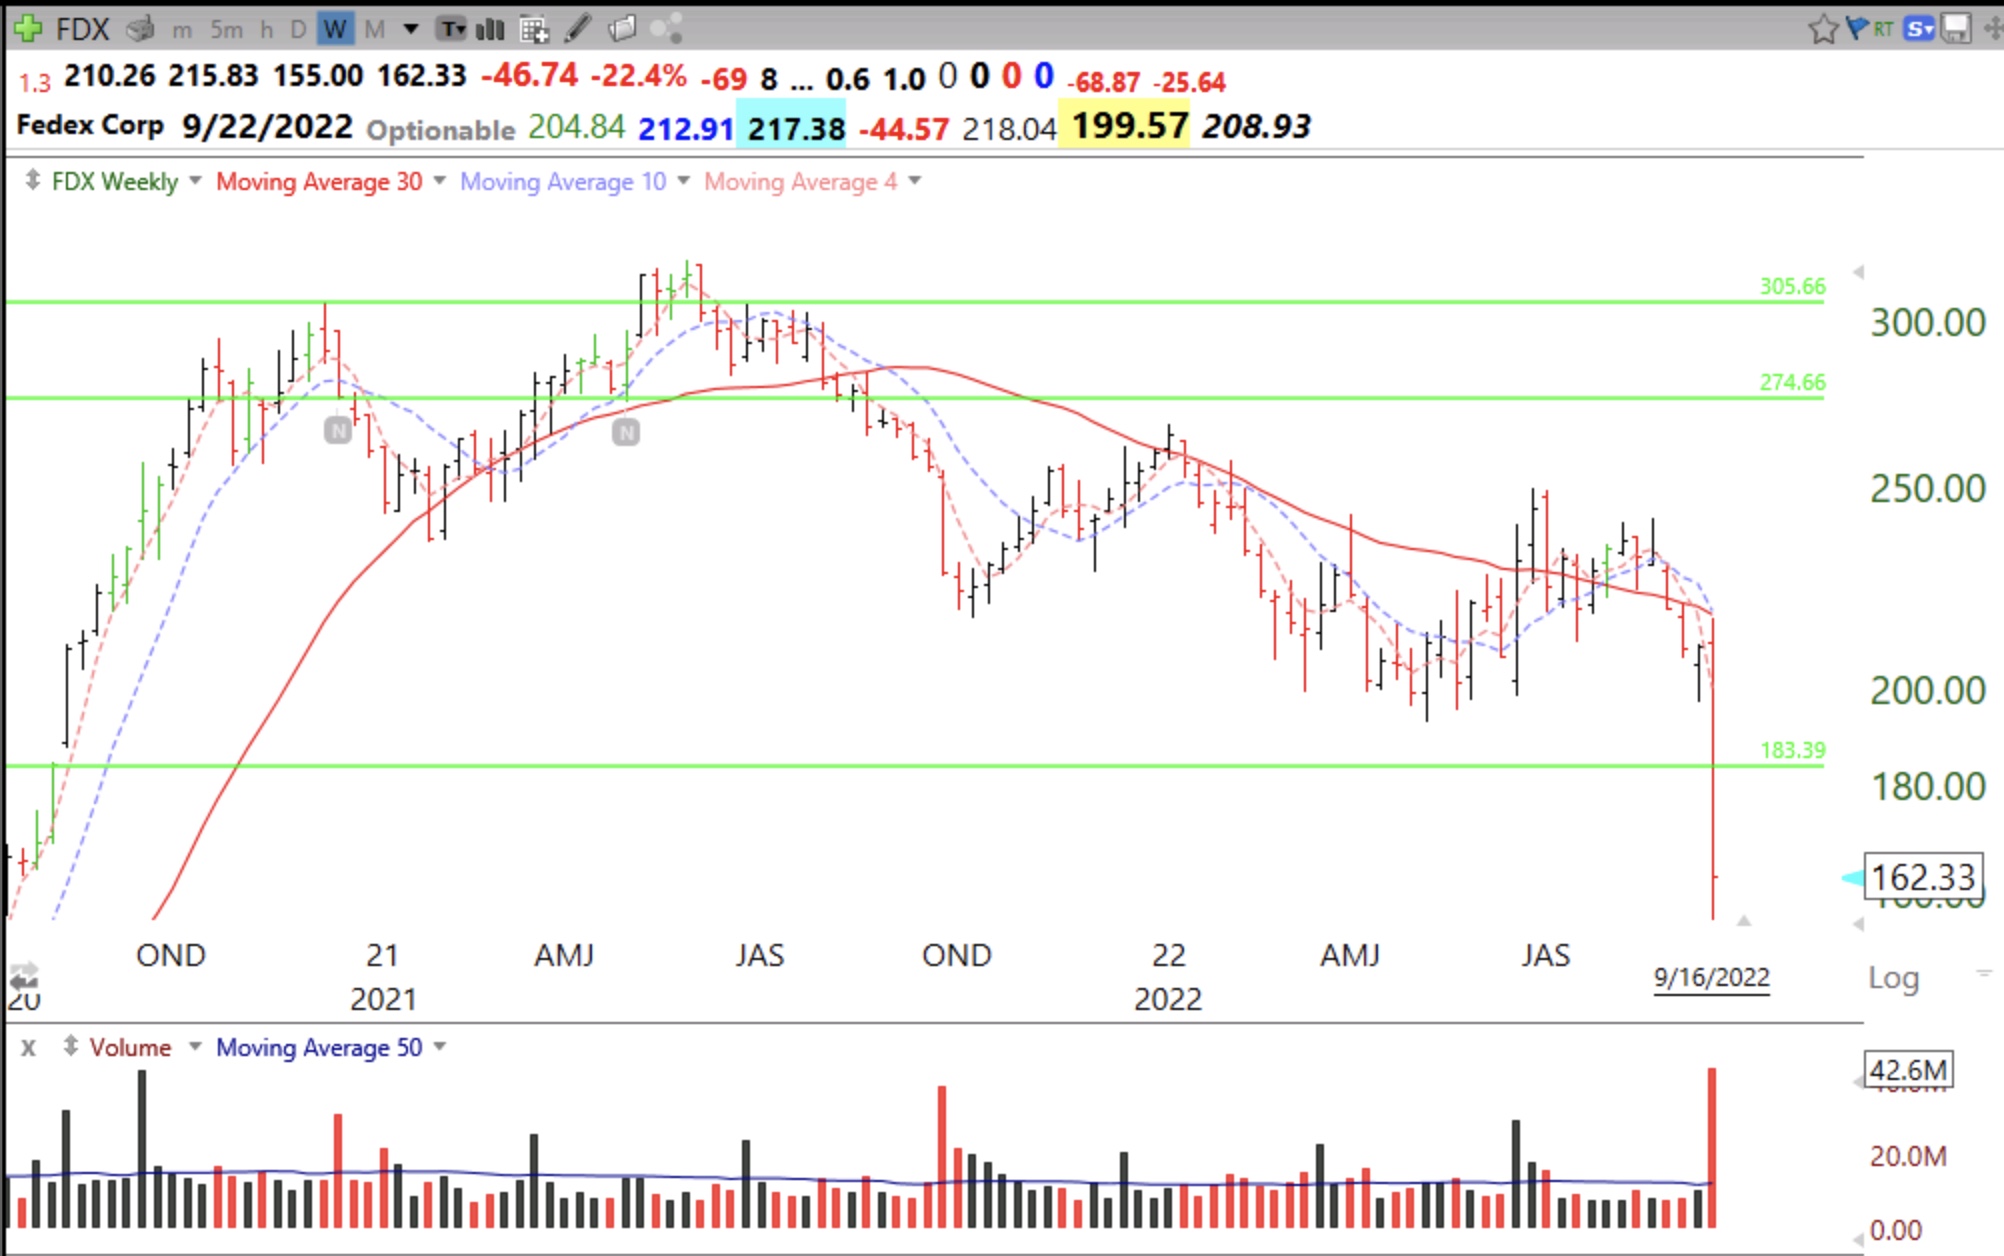
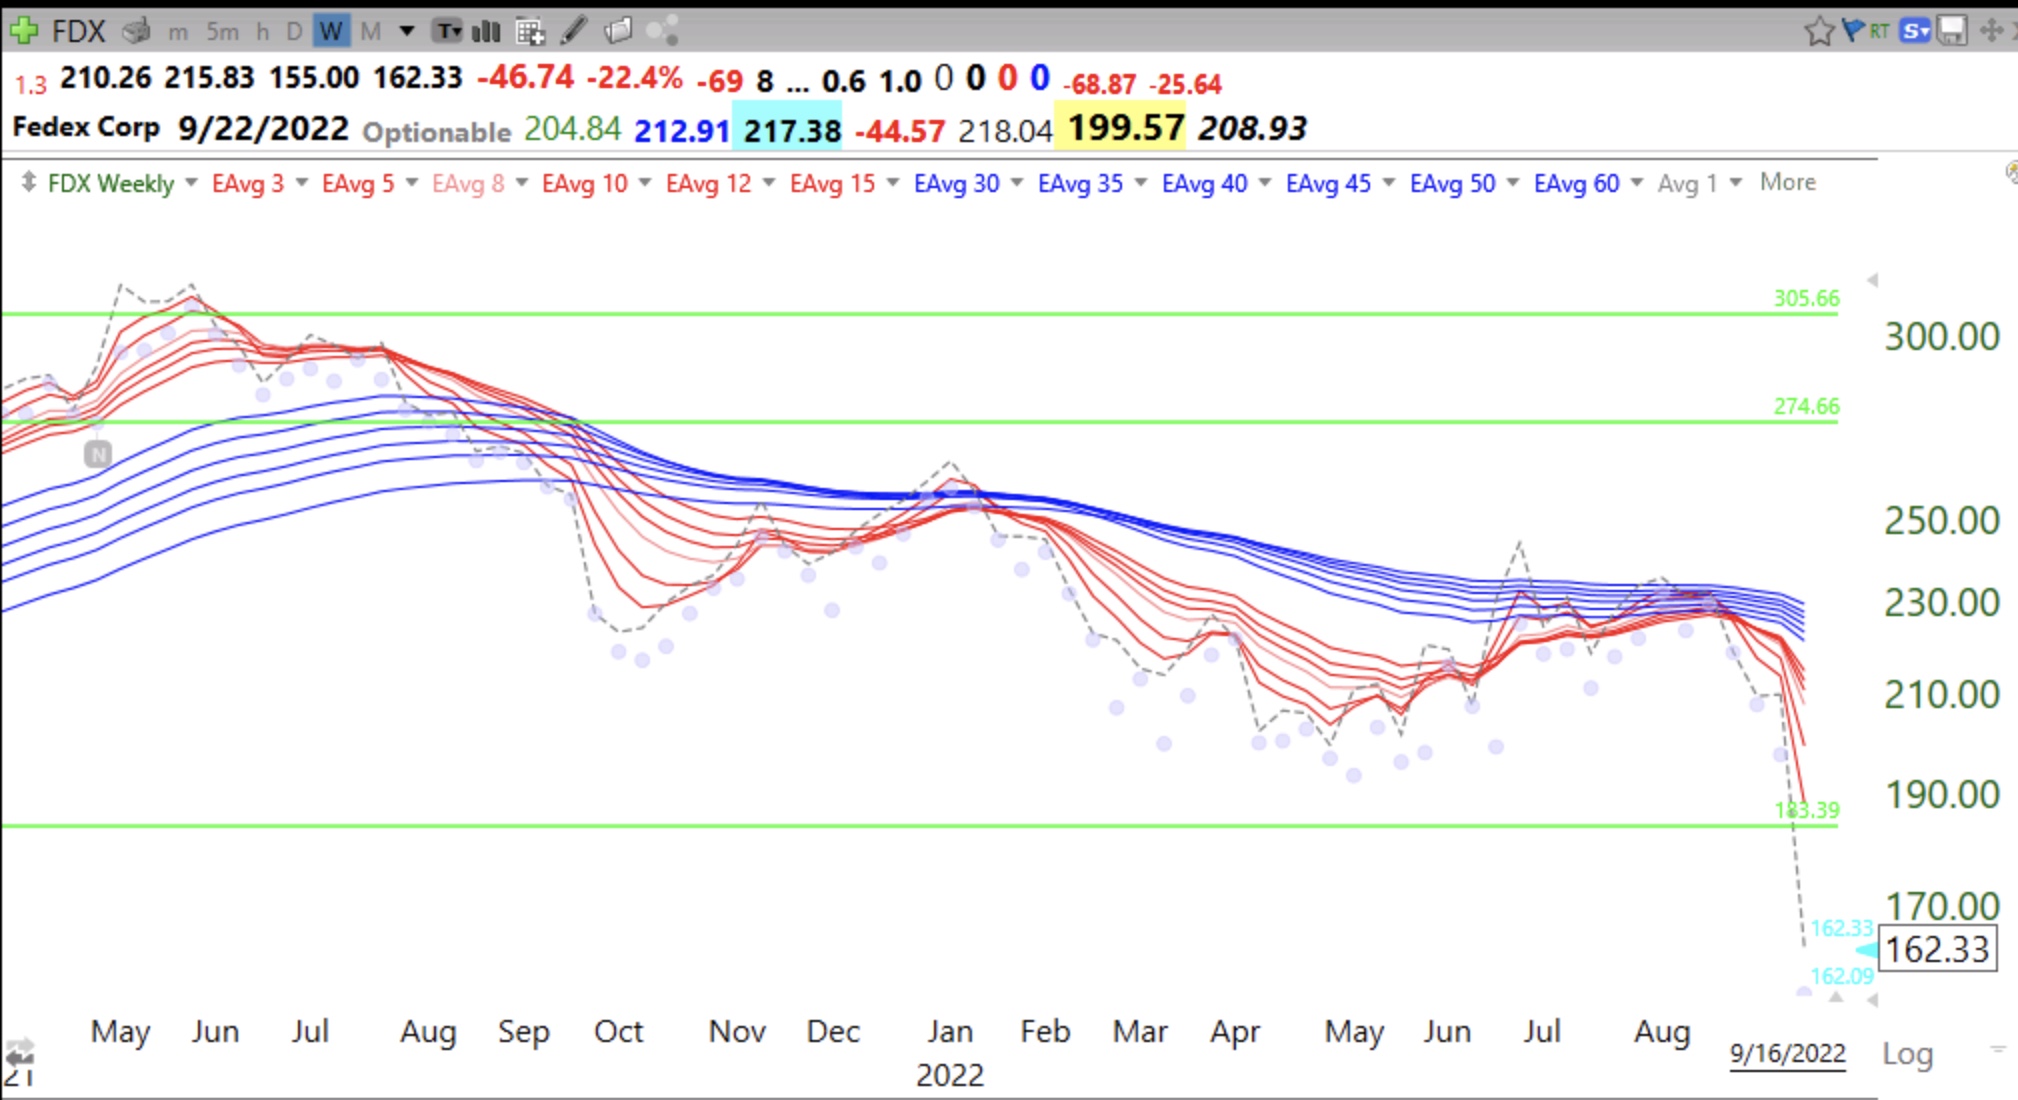
This weekly 10:30 chart provides another picture of the trend. QQQ is leading the two averages lower.

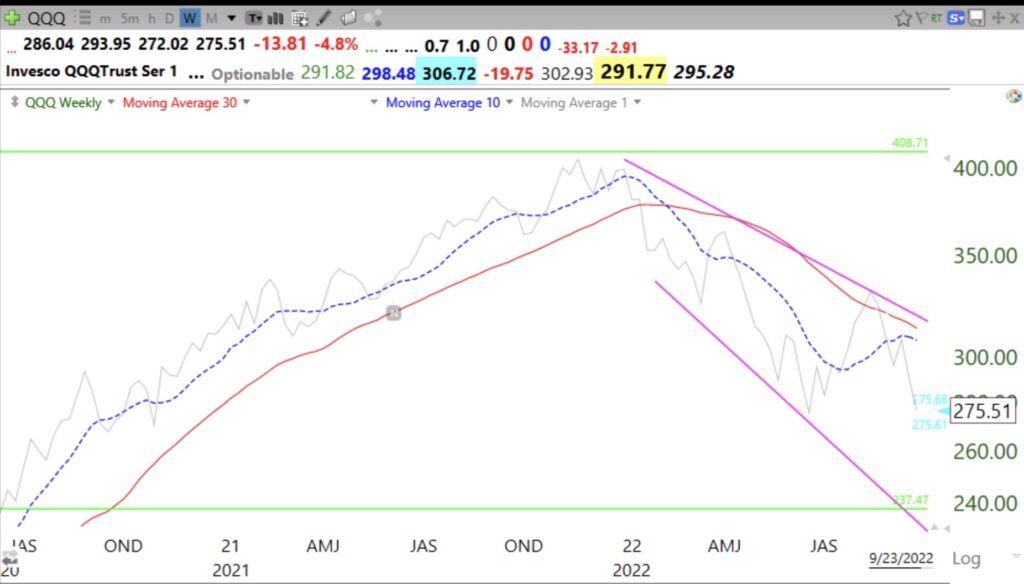
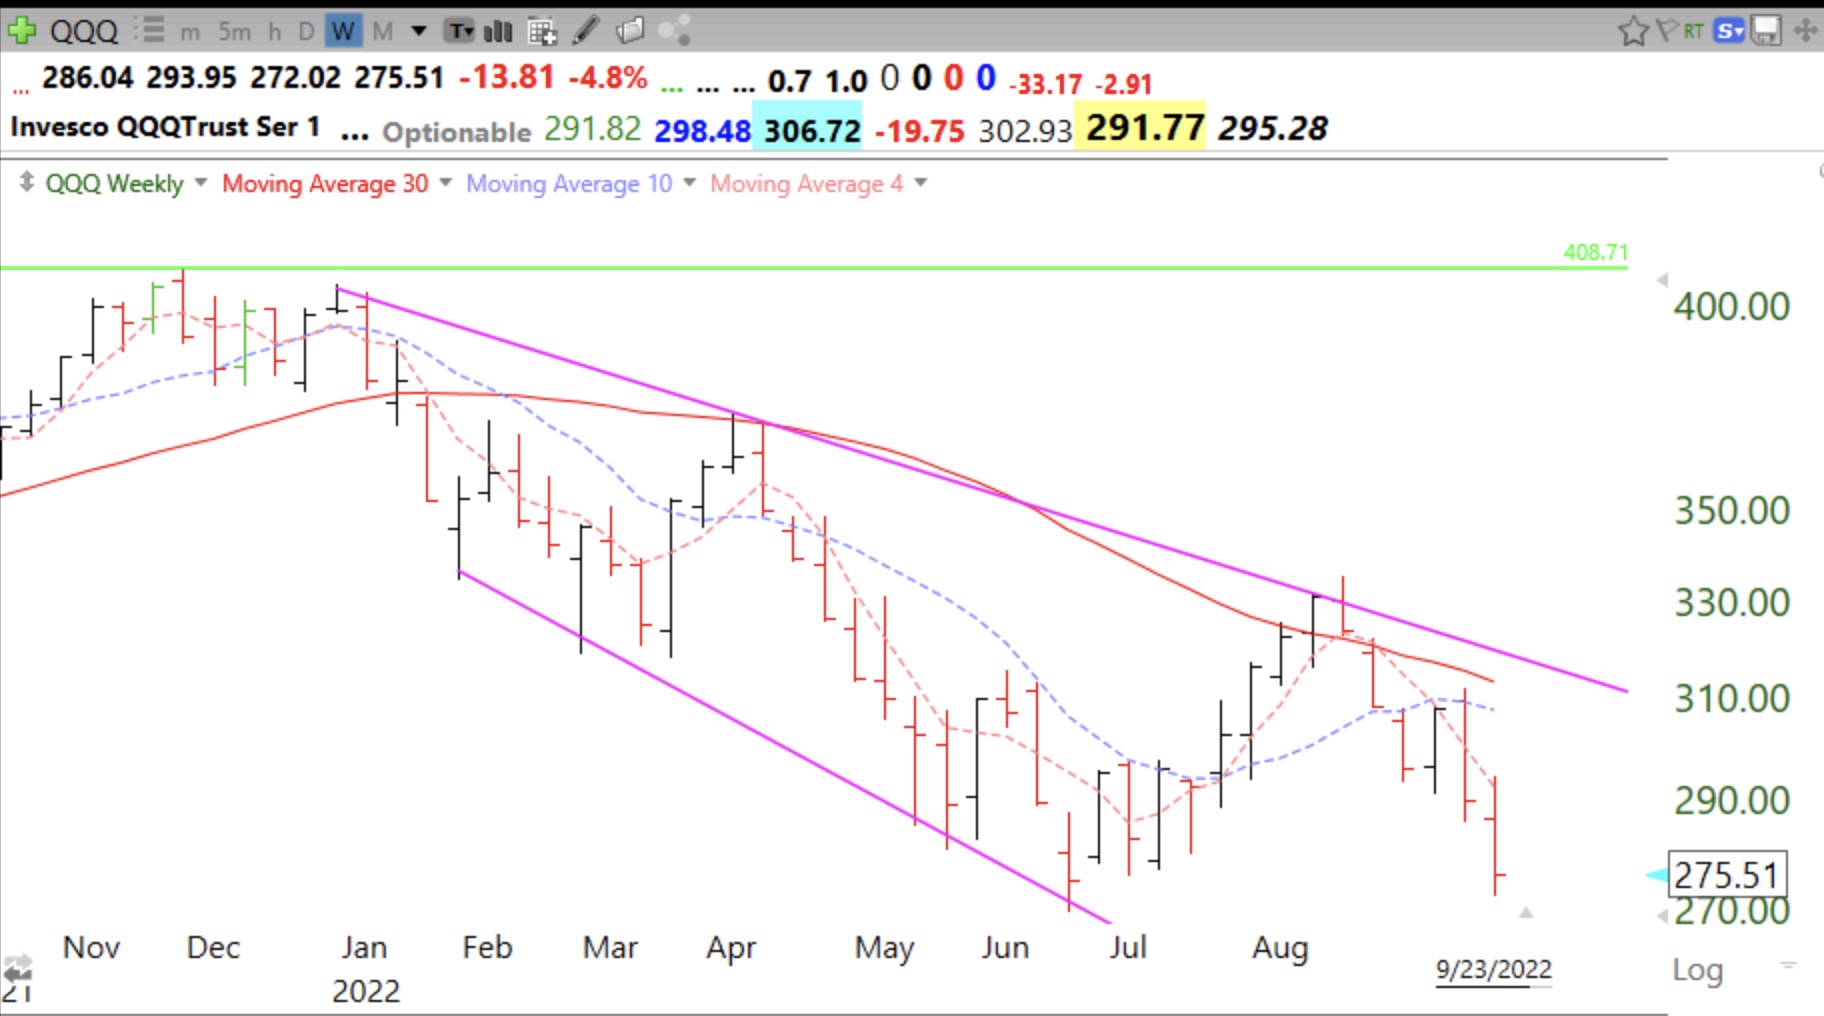
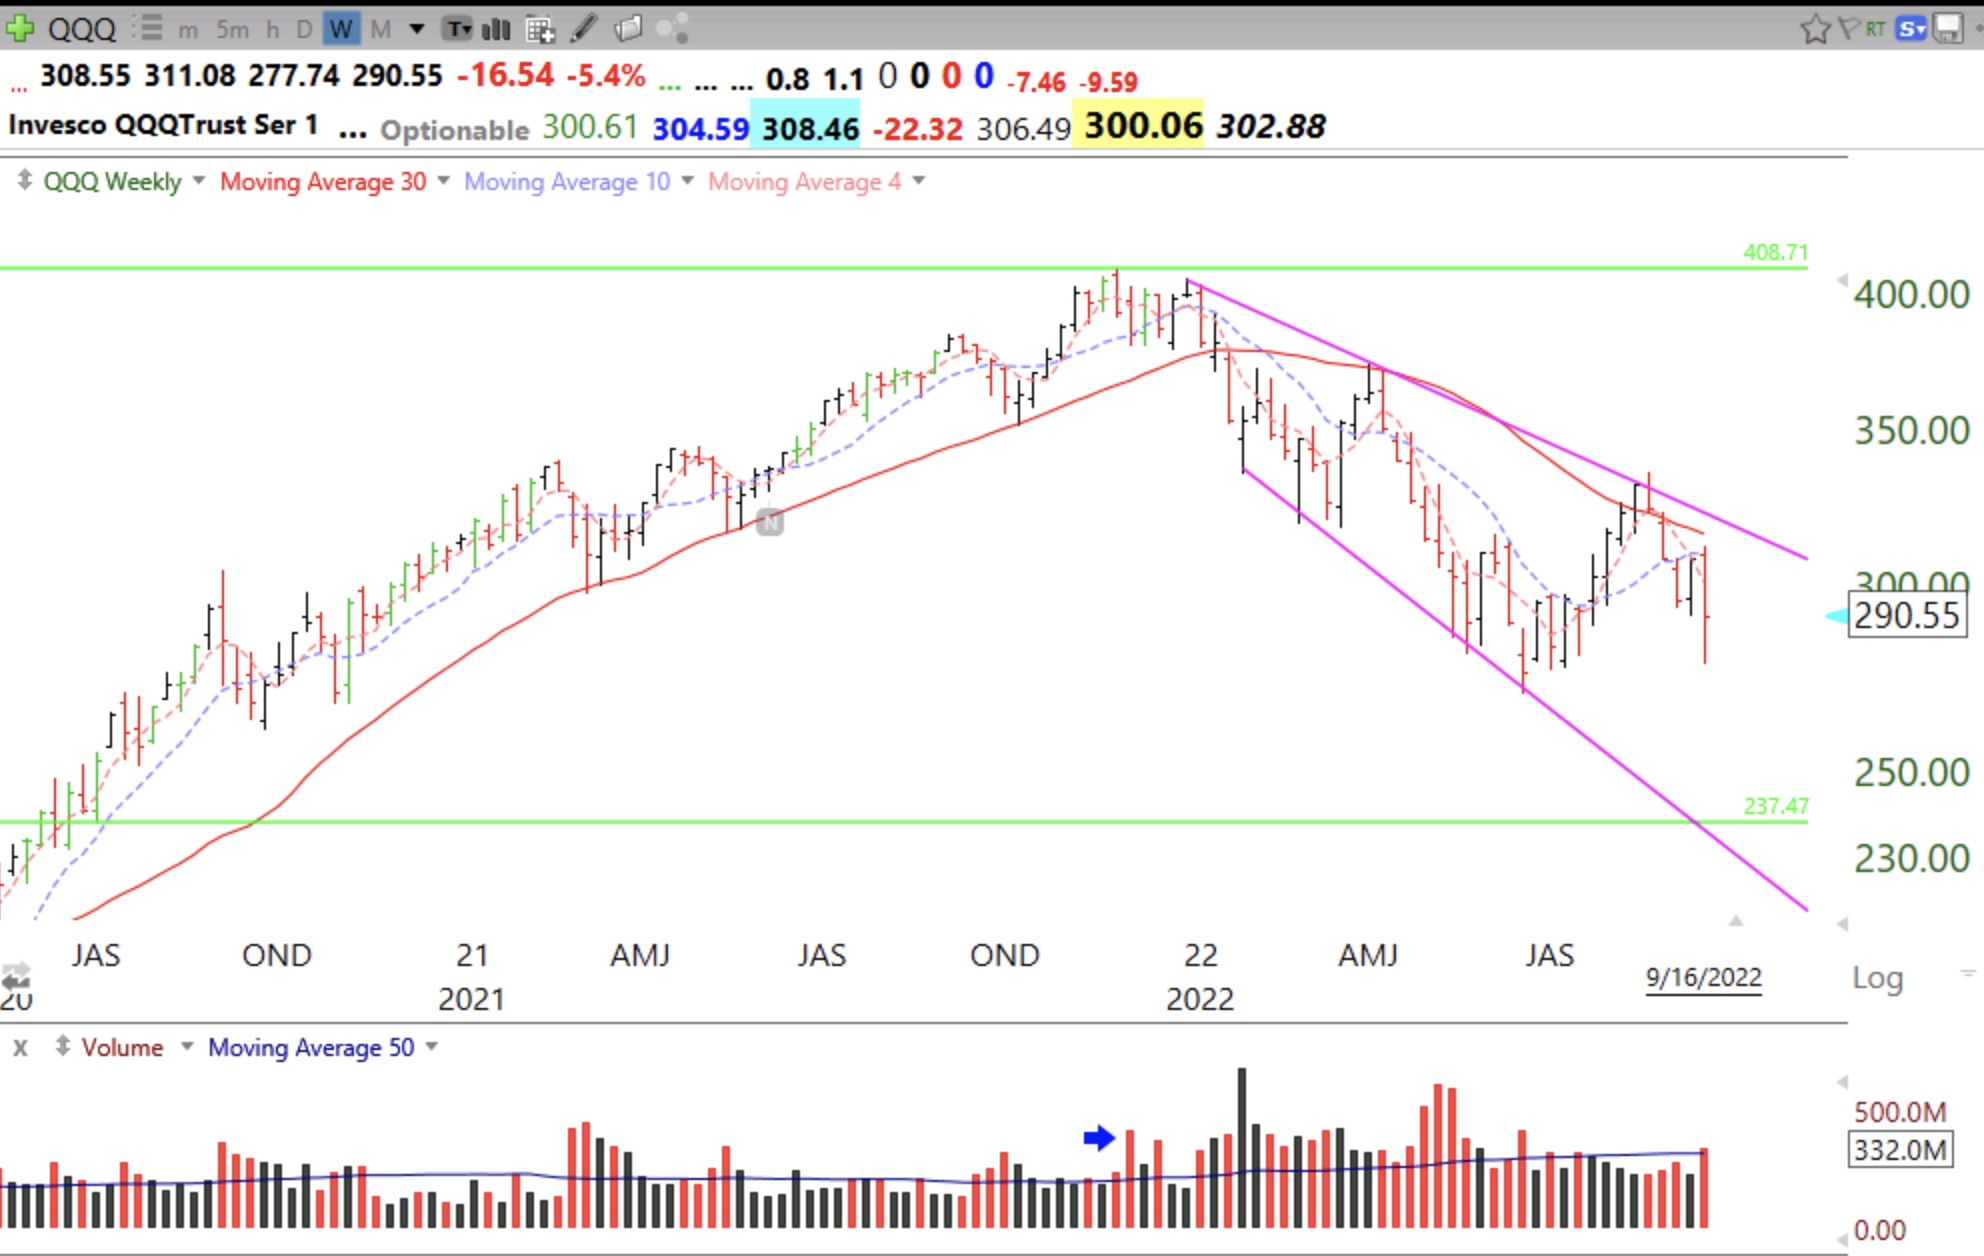
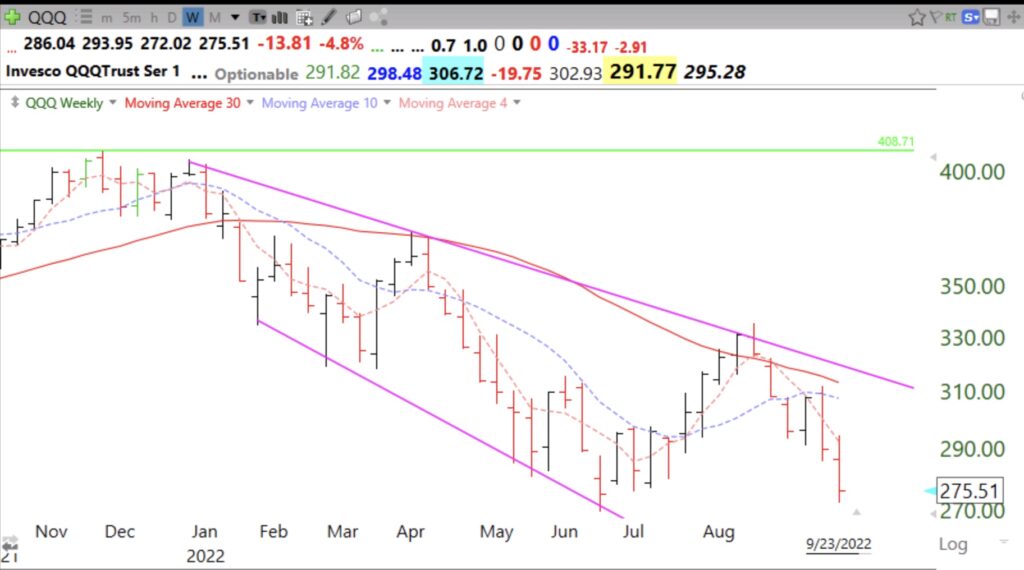
Finally, my favorite chart is  a weekly chart displaying the 4,10, and 30 week averages. QQQ kissed the 4 wk avg. last week and continued down. Note how declines tend to ride the declining 4wk average (red dotted) down. When a real market turn comes, QQQ will close above the 4wk then the 10 wk and then the 30 wk averages which will then begin to turn up. Until that happens, the down-trend is not over.  Trend followers react after the desired signals appear, not before.

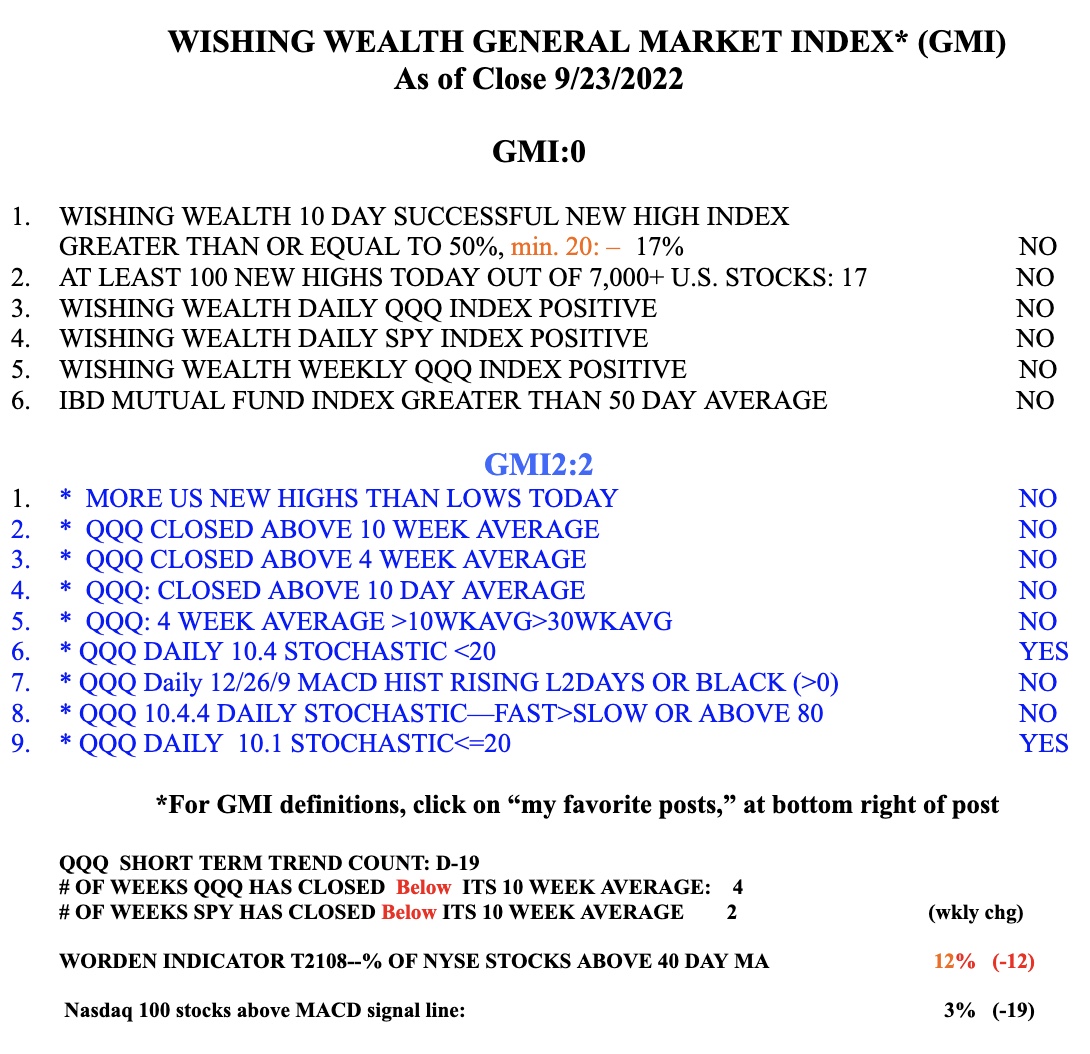
When the GMI=0, it is probably best to go short or go fishing….

Blog Post: Day: Day 14 of $QQQ short term down-trend; Where is $QQQ likely to bottom? See how technical analysis could have helped you to avoid the $FDX debacle

GMI1/6
GMI-22/9
T210824%

Will QQQ stop at the June low or will it decline to the trend channel line (237.47) and former green line top or go further below?  Note  the  above  average  volume  last week when QQQ declined.

FDX gapped down Friday after the company announced they were withdrawing guidance and feared the whole world was entering a slow down. Anyone who understood basic stage analysis would have exited FDX in August 2021 when it closed below its 30 week average (red solid line) and entered a Stage 4 down-trend. As long as the 30 week average is declining, I am out of a position or short.

FDX was also recently in a weekly BWR down-trend.


The GMI remains at 1 (of 6) and on a RED signal.