Blog Post: Day 39 of $QQQ short term down-trend; IBD switches to market in confirmed up-trend but GMI still Red; 10 promising stocks at ATHs: $INSW,$LLY,$MRK,$CI,$COP,$CDRE,$NOC,$XOM,$BAH,$SGML

GMI2/6
GMI-24/9
T210840%

Friday was considered to be a follow through day, FTD, as defined by William O’Neil. An FTD is necessary but not sufficient for a new bull market to begin– every new bull starts after a FTD but not every FTD leads to a new bull market. There have been several failed FTDs lately. So we must wait and see.

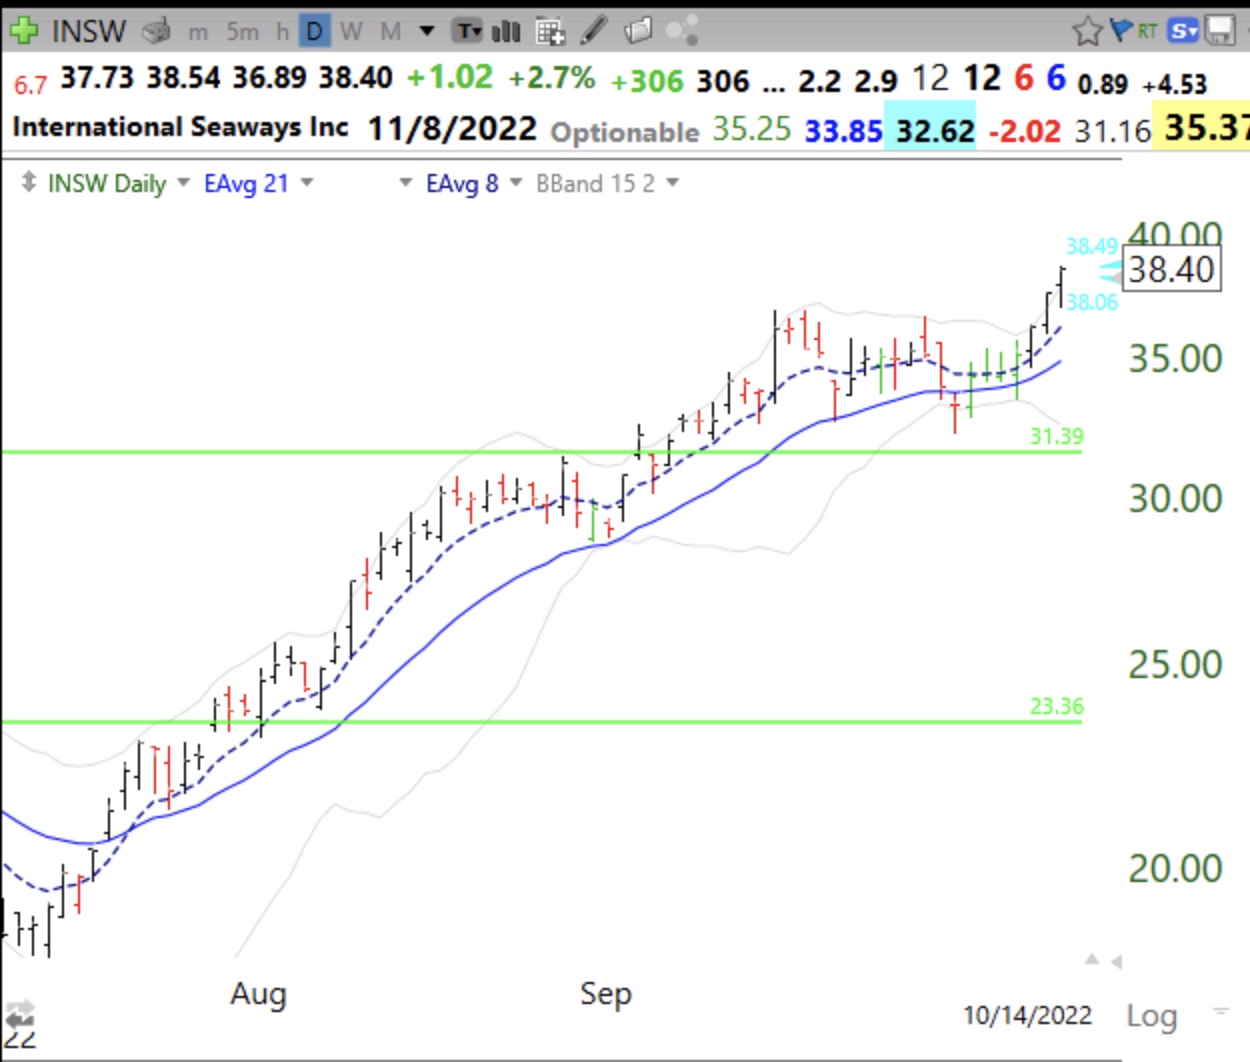
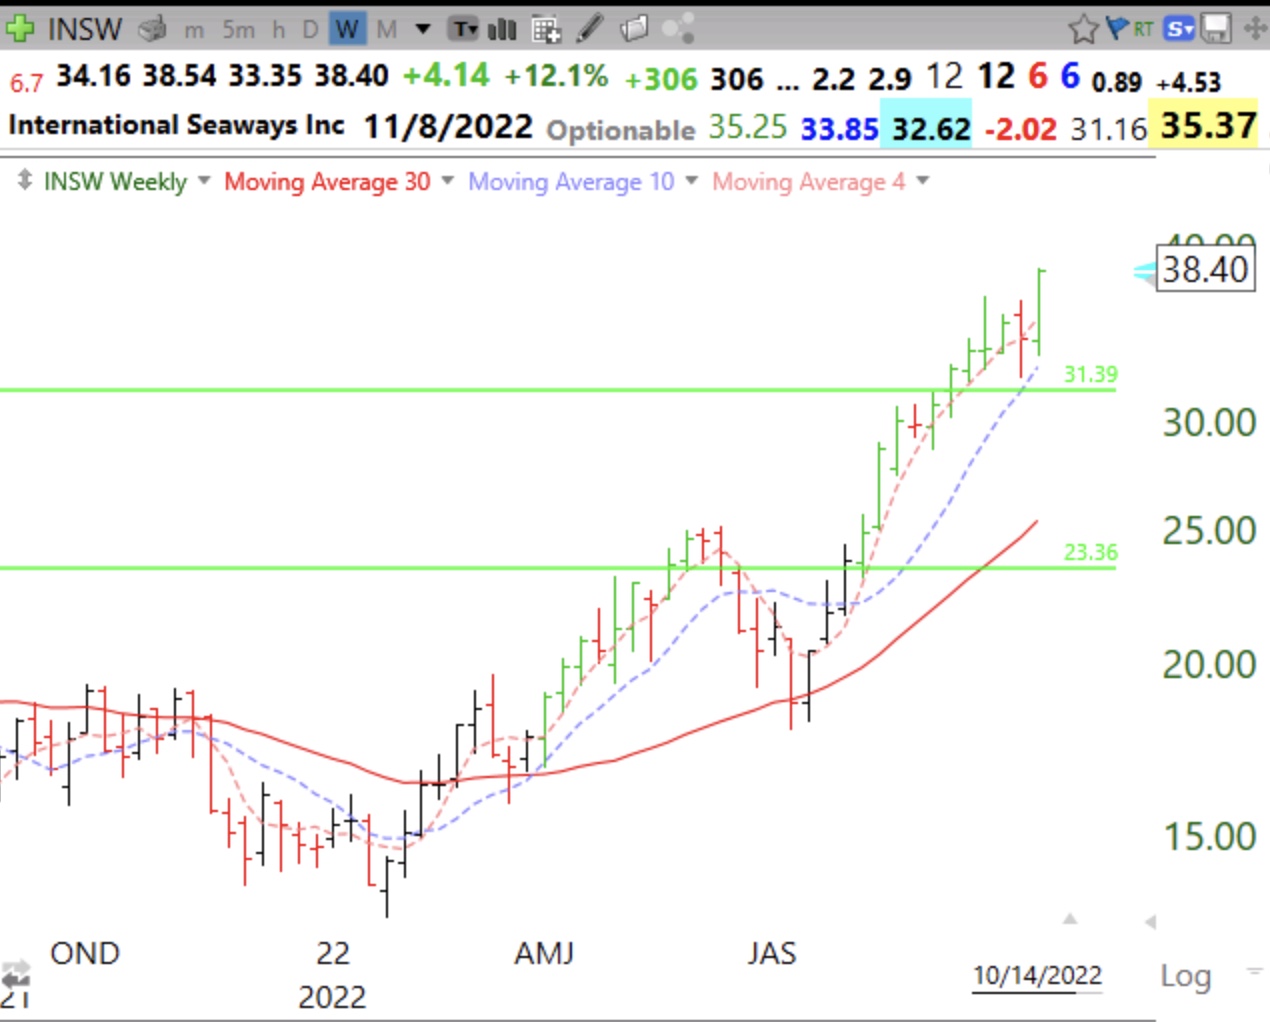
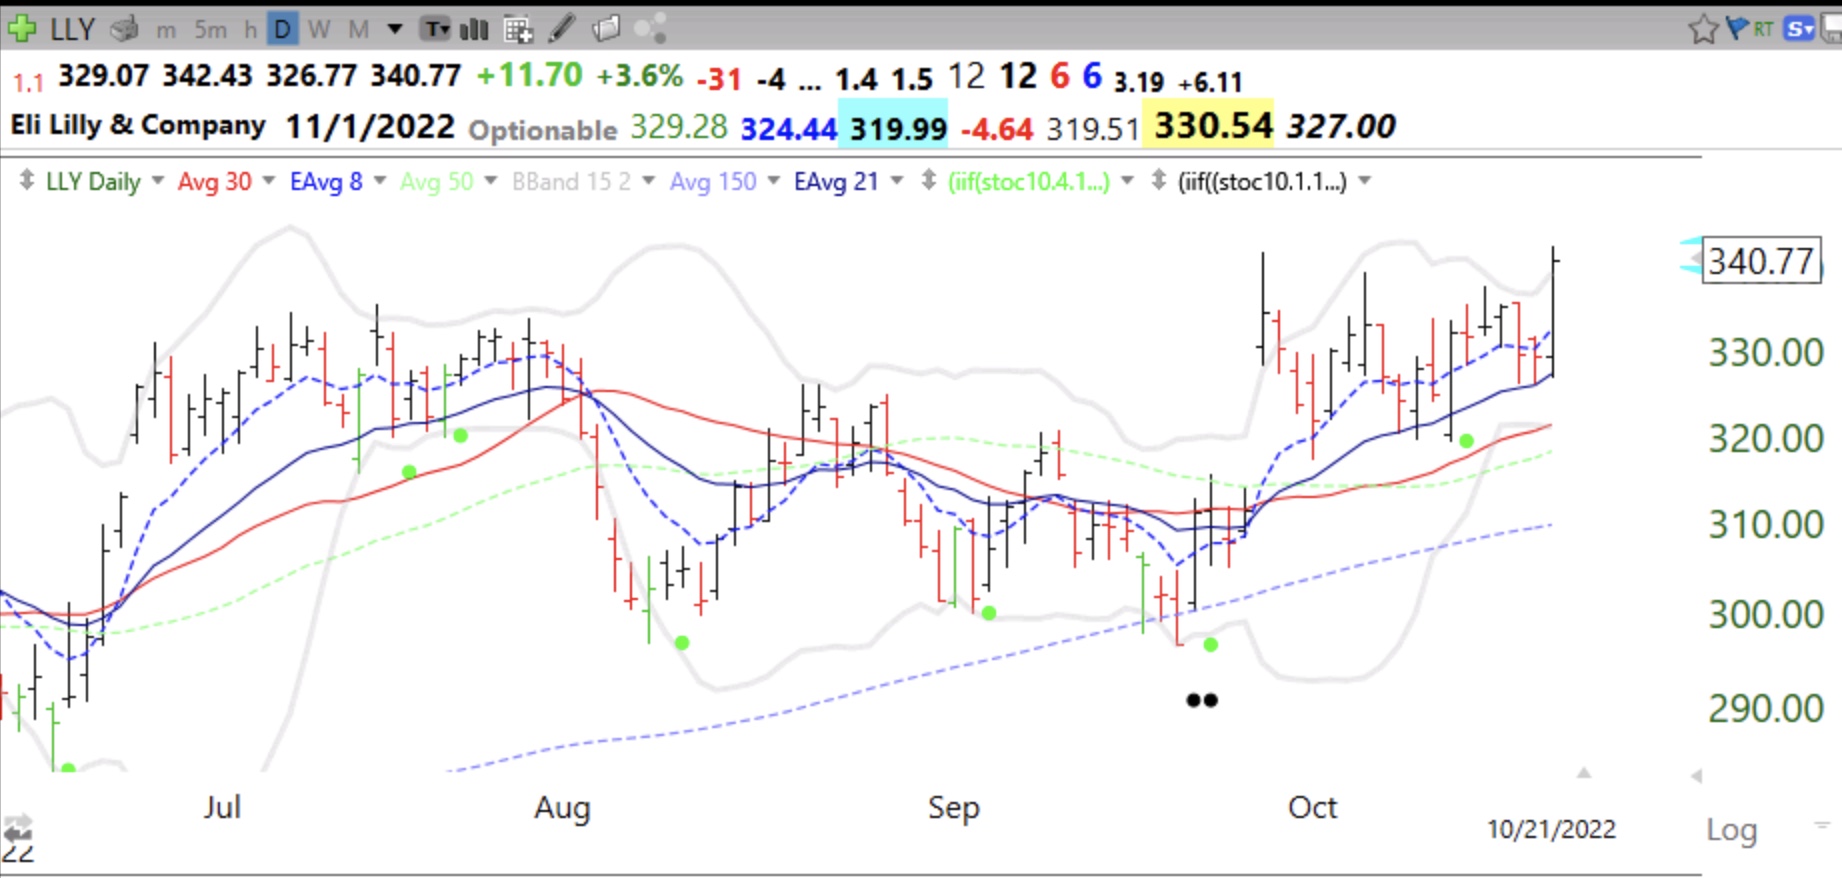
In the mean time, a number of stocks came up on my ATH scan: INSW, LLY, MRK, CI, COP, CDRE, NOC, XOM and BAH. These are all on my IBD/MS recent watchlists. After its huge gap up on 9/28, LLY finally went to an ATH on Friday and bears watching, given its promising drug pipeline.

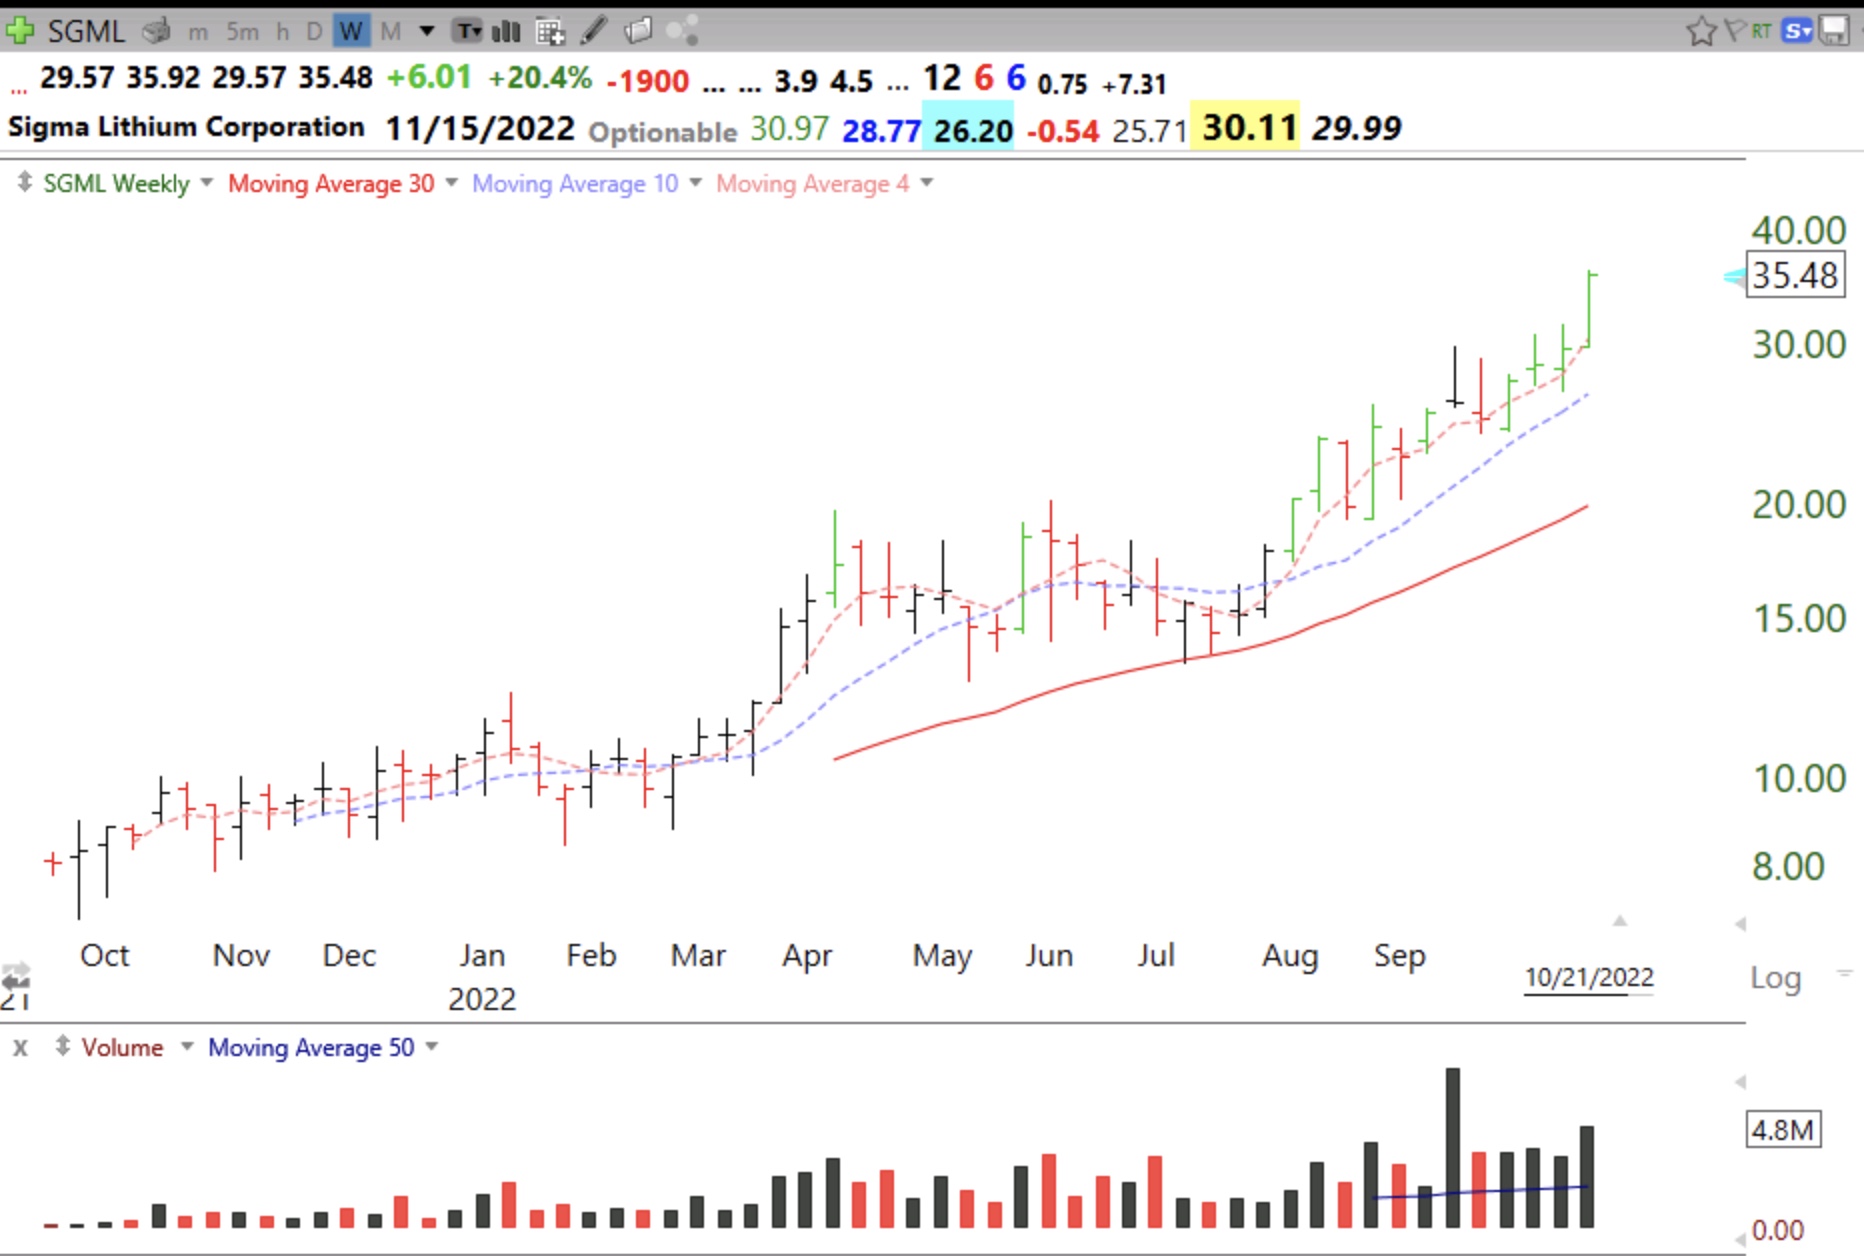
One stock at an ATH not on that watchlist, that I own is SGML. Its weekly chart has a weekly green bar and 4wk>10wk>30wk pattern. Lithium will be needed for all of those coming EV batteries. As long as it closes each week above its 4 week average I will hold it. Note the recent heavy volume.

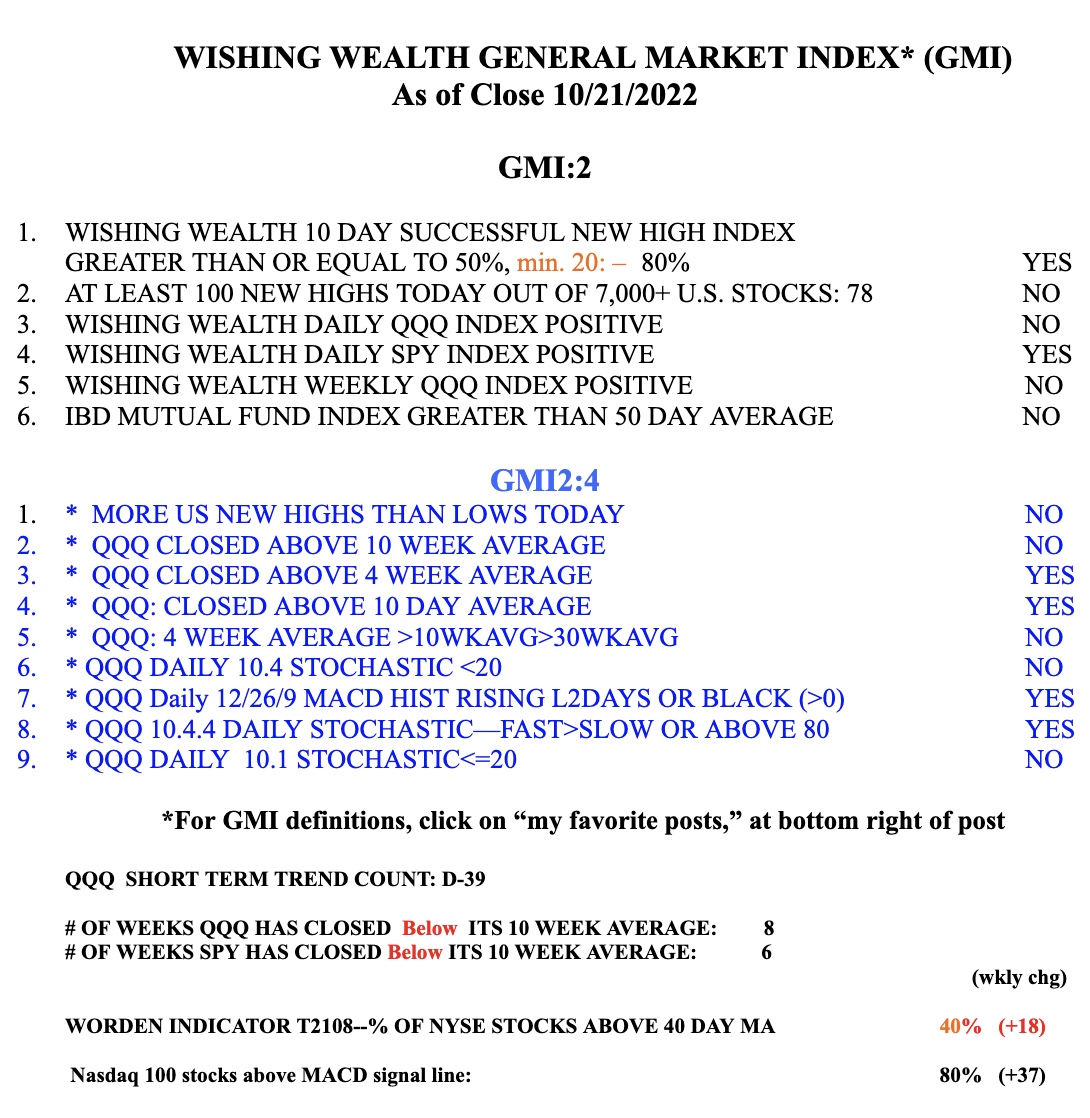
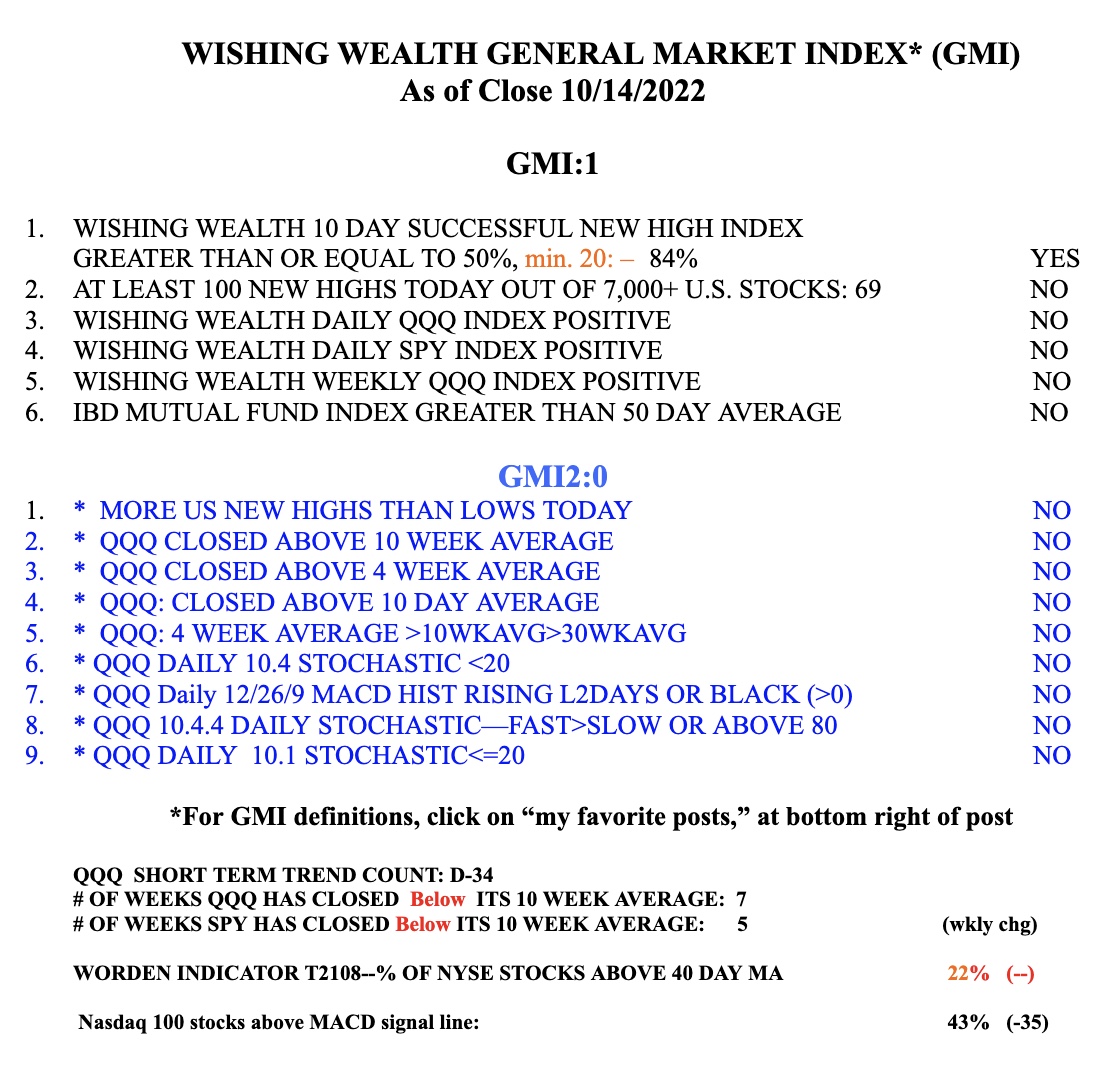
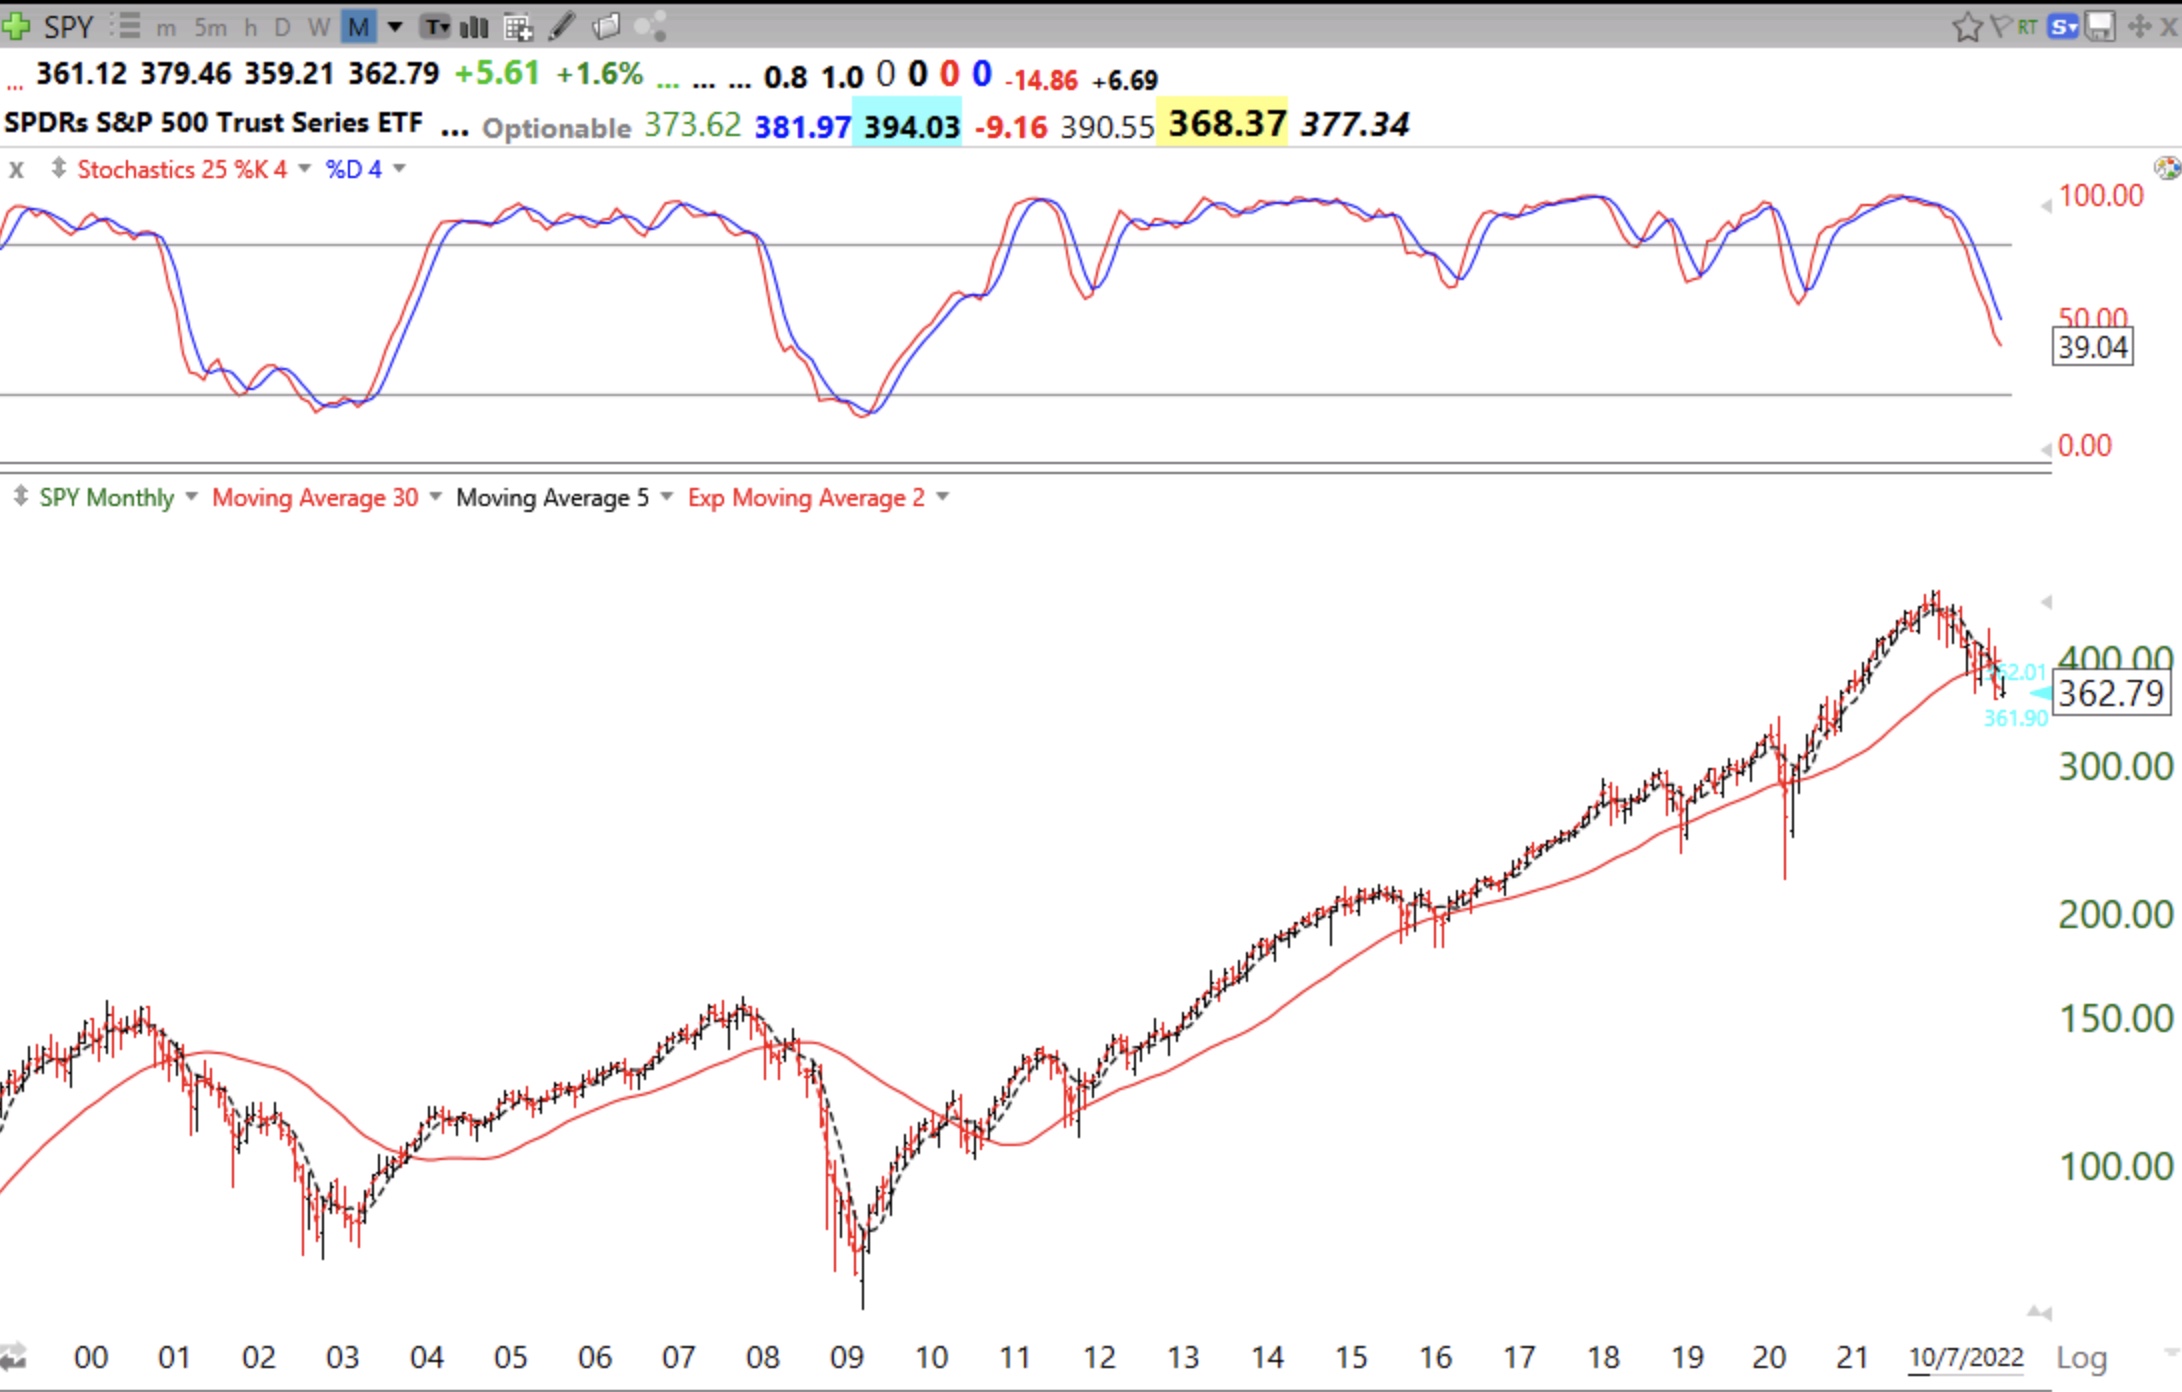
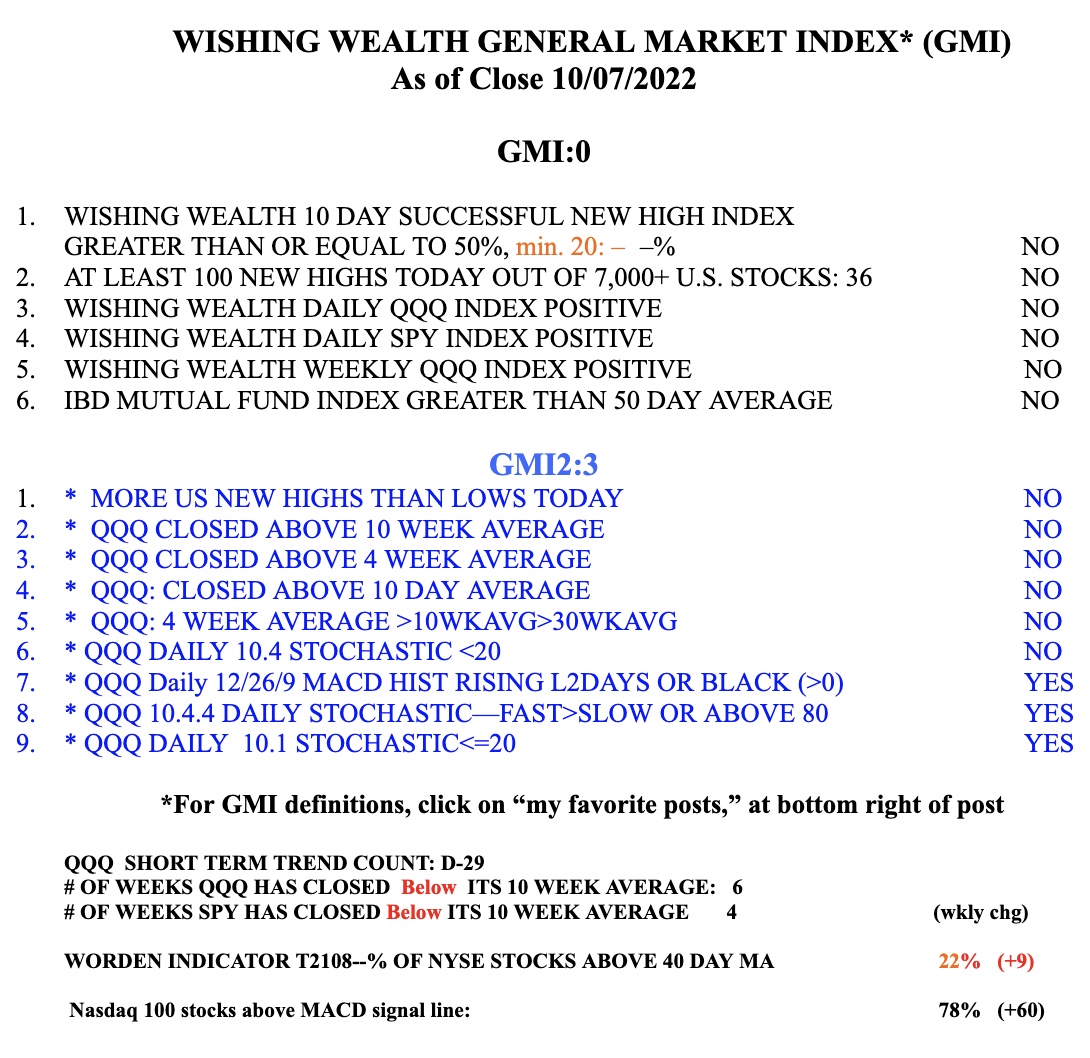
The GMI remains Red.

Blog Post: Day 34 of $QQQ short term down-trend; $INSW hits another ATH, see daily and weekly charts

GMI1/6
GMI-20/9
T210822%

This daily chart shows the 8 ema (dotted line) and 21 ema. Note that the 8 crossed above the 21 last July and has remained above it since. This crossover could be a potential set-up as long as the stock is in a Stage 2 up-trend, which the weekly chart confirms. Note the weekly chart shows 4wk avg>10wk avg> 30 wk avg, a strong Stage 2 pattern. Note the series of weekly green bars indicating a bounce up off of the rising 4 wk avg.


GMI remains RED and registers 1 (of 6).

Blog Post: The decline in $SPY is small compared with those in 2000 and 2008, and the monthly stochastic is nowhere as oversold as occurred at major bottoms, see monthly chart

GMI0/6
GMI-23/9
T210822%

This is a monthly chart with a 25.4 and 25.4.4  stochastic. The 25.4 stochastic is currently at 39.04, but the 2003 and 2009 bottoms occurred  with readings below 20.  This down-trend actually appears minor compared with those declines and  may have a ways to go. Why try to guess a bottom or catch a falling knife when one can rest calmly on the sidelines? This chart shows that there are years to ride the new bull after a new up-trend has been established.

The GMi is back to 0 (of 6) and on a RED signal.