My university retirement accounts only let me invest in mutual funds, one of which is Fidelity Contrafund. That fund is one of the best performing funds in strong growth stock markets. When one of my scans detects a stock, I am more likely to buy it if Fidelity Contrafund has invested in it. The charts below show how well the fund has done in the past. The weekly chart shows the GLB.

I have found in this 10:30 weekly chart that when the 10 week average (dotted line) closes above the 30 week average (solid red) it can signal a major up-trend. The reverse is true. The recent changes in trend are shown by the red and green arrows. The gray line shows the weekly close, which, of course, leads the averages.

The monthly chart shows this fund’s performance since its inception.

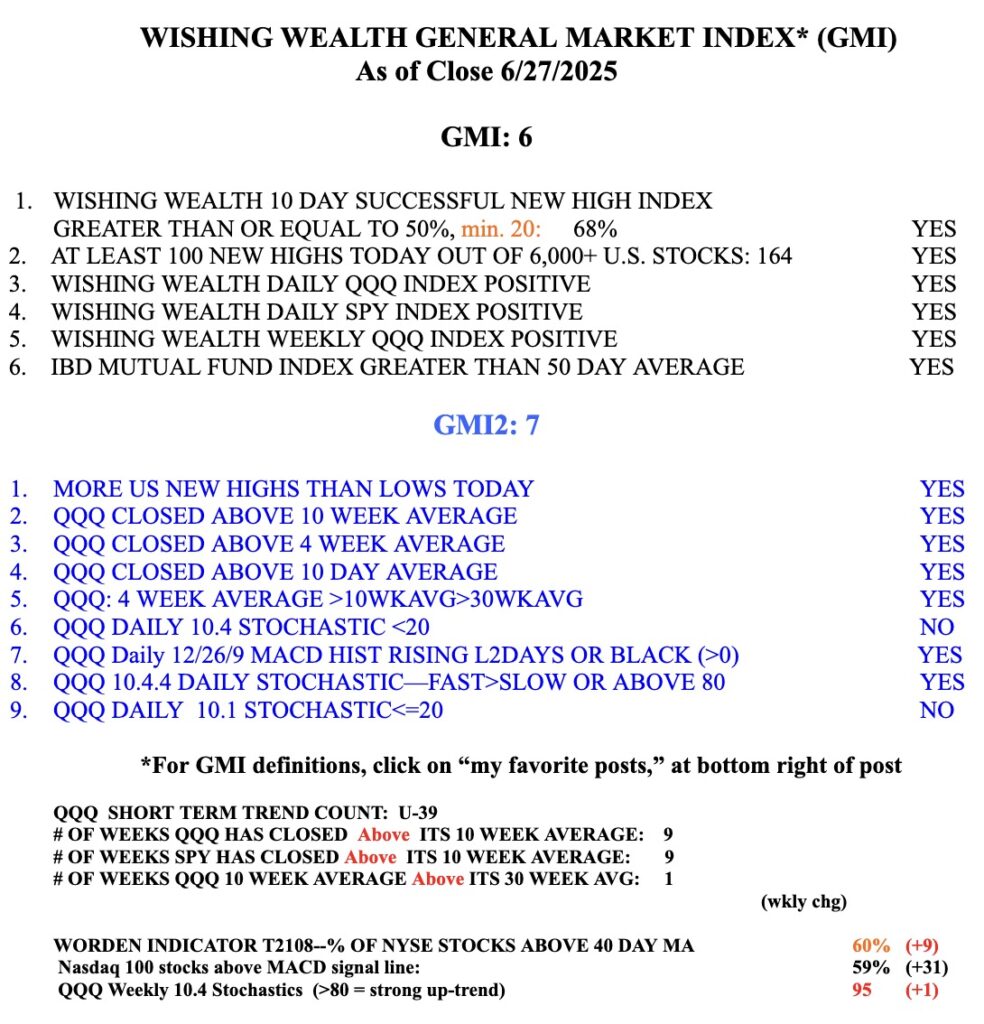
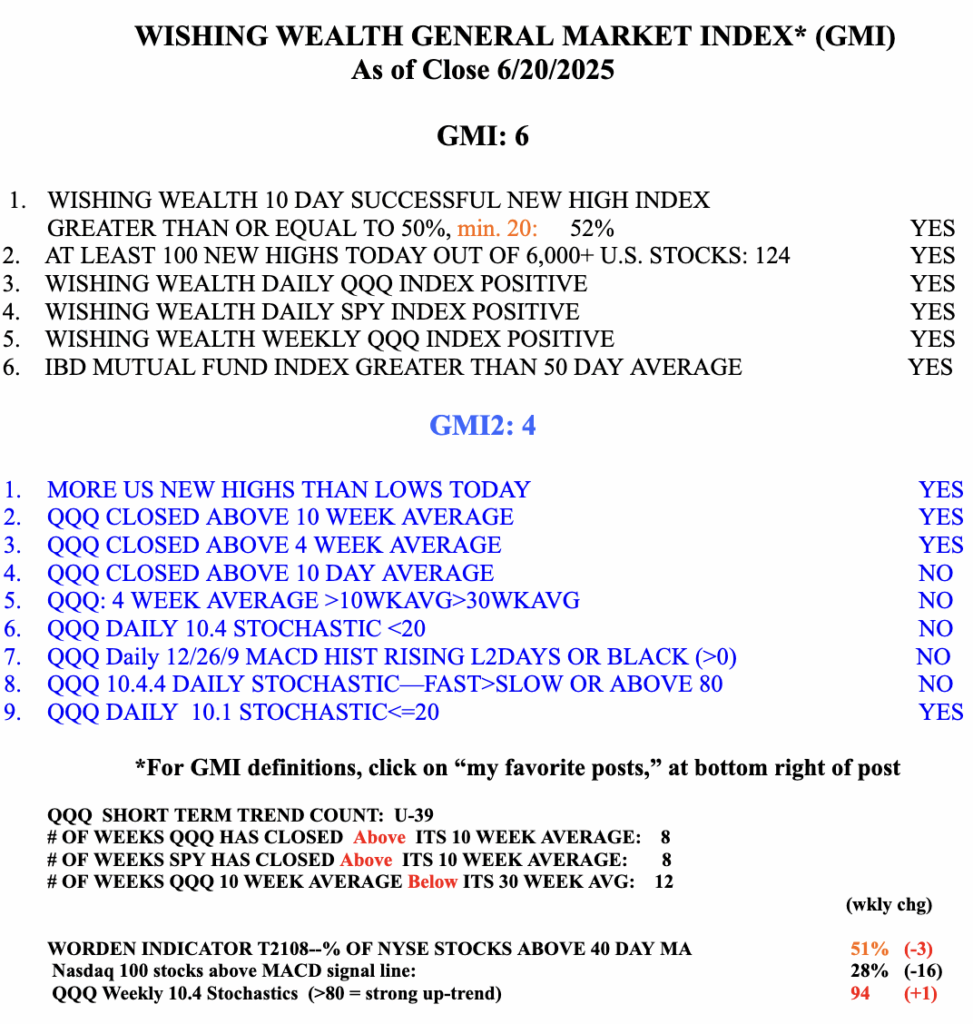
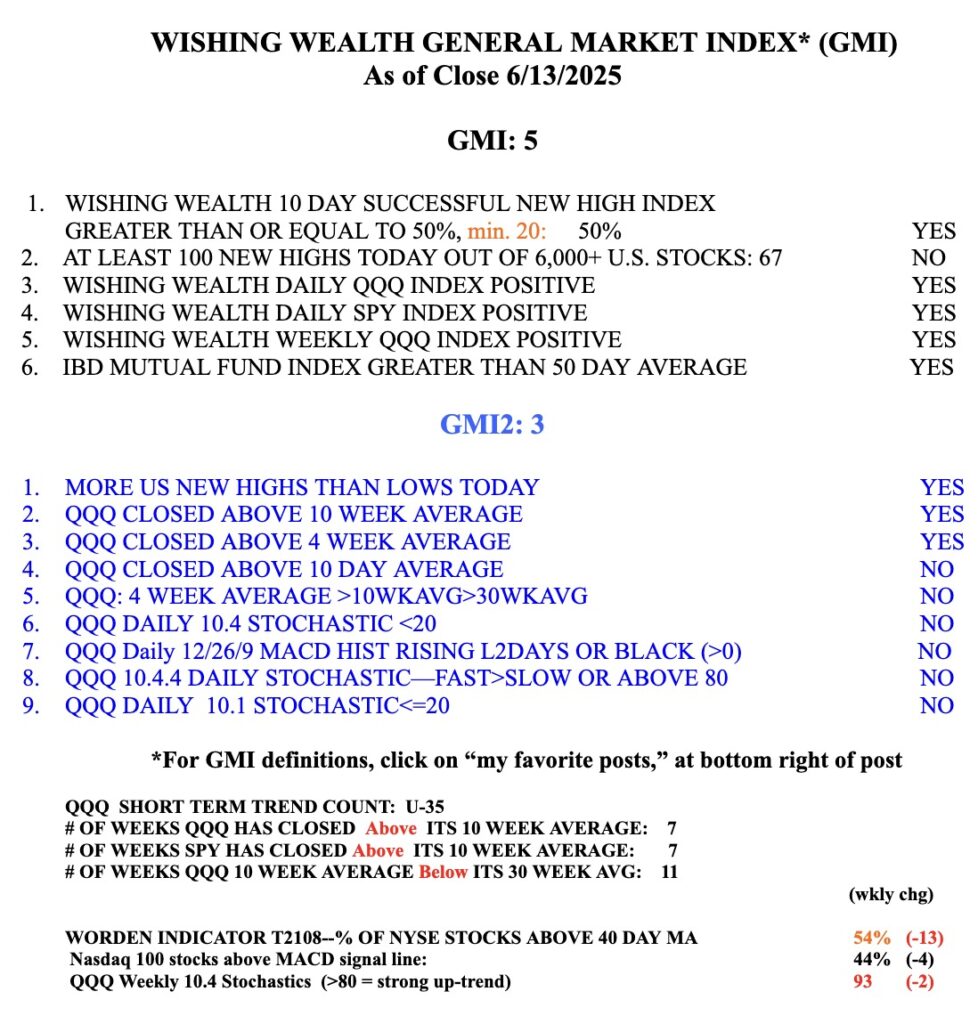
Just as Contrafund has now had its 10 week average cross above the 30 week, the same is true of $SPY and $QQQ. $QQQ’s signal is noted near the bottom of my GMI table below. I have been slowly transferring cash from money market funds to mutual funds and stocks.
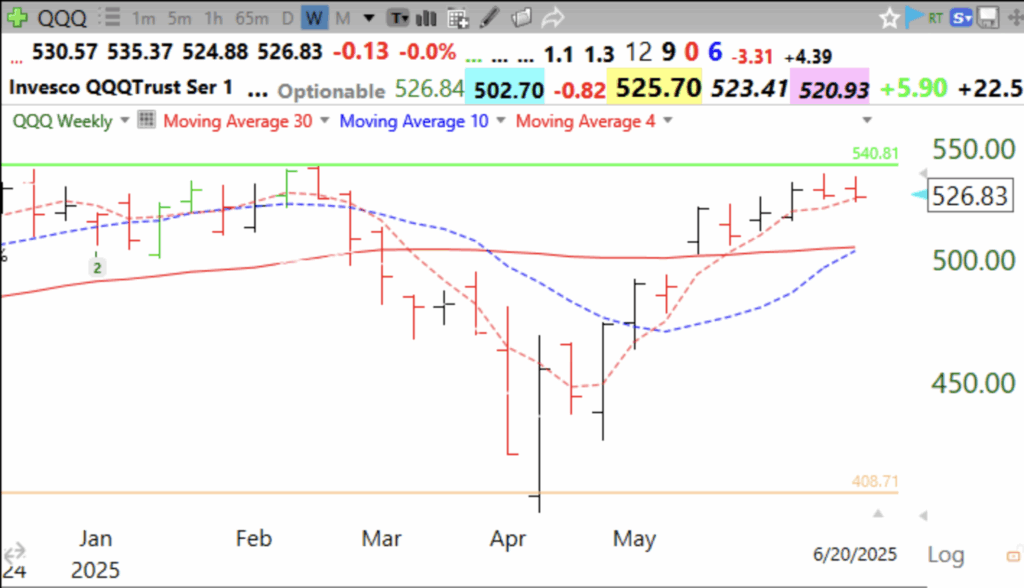
My modified weekly Guppy chart below shows that QQQ is also back to a weekly RWB up-trend. With the GMI= 6 (of 6), I think the odds are great for me to trade long. I am gradually investing long again. I focus on the market’s movement and ignore the news and mental masturbation of the many media pundits. I believe I heard Steve Forbes once say that his father told him that it is far easier to make money selling advice than by trading. No one can reliably predict in advance what the market will do, except occasionally, by luck or chance. I watch my indicators and ALWAYS limit my losses. That is the way to survive in the market. I have been trading or investing for over 60 years. One of the best ways to learn how to limit losses is described in a chapter in the recently published book, the Trader’s Handbook. My former student, Richard Moglen, is the first author. (I wrote the foreword and receive no compensation other than a sample copy.)