This monthly chart of the QQQ shows that the current decline is negligible, compared to those in 2001 and 2008, and even 2015/16! Only time will tell whether it will turn into a a major decline….
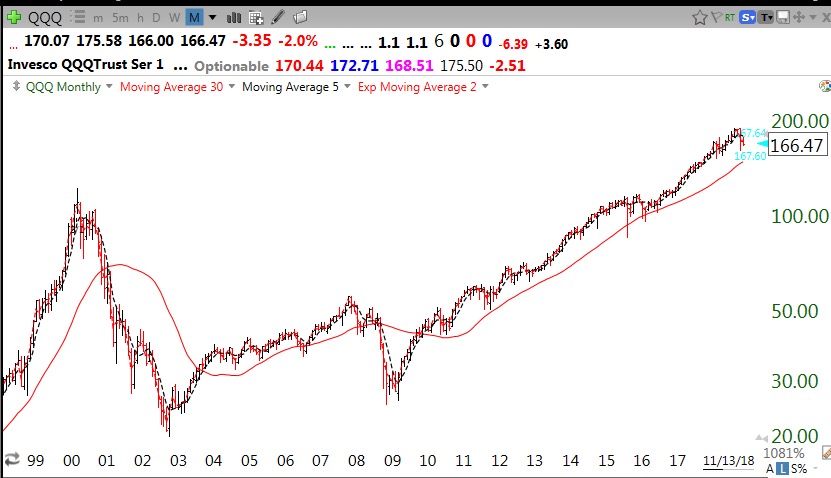
I will post again this weekend.
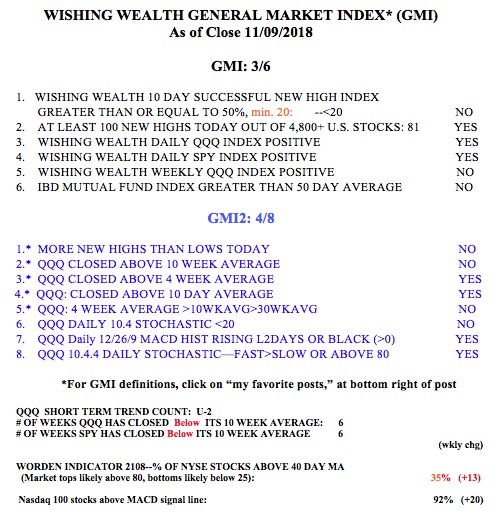
Stock Market Technical Indicators & Analysis
This monthly chart of the QQQ shows that the current decline is negligible, compared to those in 2001 and 2008, and even 2015/16! Only time will tell whether it will turn into a a major decline….
I will post again this weekend.
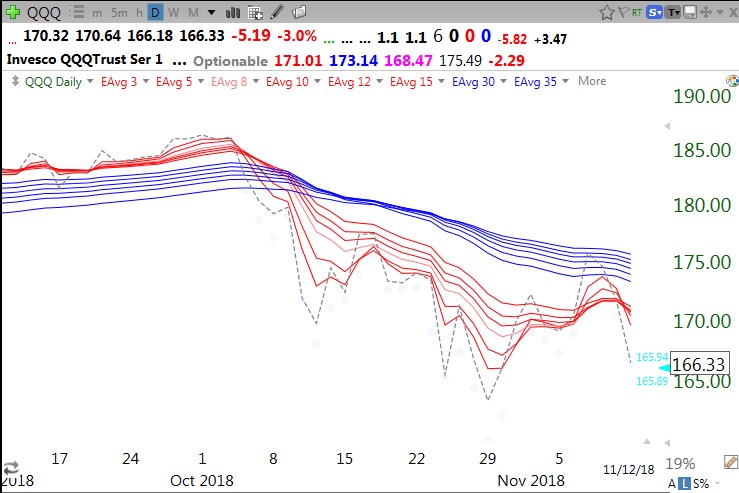
Daily BWR down-trend of the QQQ continues. GMI could turn Red on Tuesday.
The GMI=3 and the new QQQ short term up-trend could end with a weak day on Monday. Still too early to go back in on the long side. Perhaps because the GMI changed to Green last week, 80% of my students were bullish on Friday, the highest reading this semester. In the past, my student poll has performed well as a contrarian indicator. So watch out below!
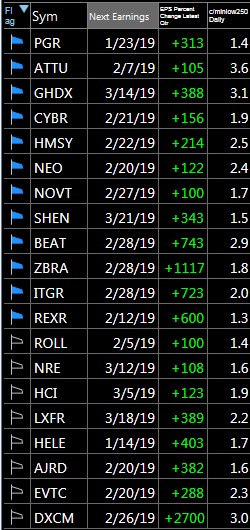
A number of stocks have recent triple digit earnings gains, are near all-time highs and in daily and weekly RWB up-trends. Here is a list I uncovered this weekend using TC2000. The last 2 columns show the EPS change last quarter and how much the stock is up over the past year (close/minlow past 250 days). Nine of these 20 stocks closed Friday more than twice their lowest price the past year. Stocks with a blue flag appeared on one of the IBD lists at some point.