I noticed over the weekend the incredibly weak price trend of just about all stocks and ETF’s that are related to India. I learned a long time ago that when the U.S. Federal Reserve raises interest rates to combat inflation, it eventually leads to a market decline. When the Fed thinks that the economy is growing too fast and likely to produce inflation, it applies the brakes by raising short term interest rates. Higher interest rates mean higher costs for businesses and consumers who borrow money, and the economy slows. Because fine tooling the economy is an inexact science, the Fed usually errs by applying the brakes too hard, bringing on a larger slow down than intended, and often a recession. Thus, a series of rate hikes usually kills a market up-trend. The very smart stock analyst, Martin Zweig, many years ago published a careful empirical analysis of the impact of the Fed’s actions on the U.S. stock markets. Of course, in the United States the Fed is still stimulating the economy by buying securities and printing money.
However, a series of interest rate hikes is currently occurring in India. I found this article after the weakness in India stocks prompted me to search for any explanation. I first wrote about the India auto manufacturer, TTM, last August, when it closed at $22.49, an all-time high.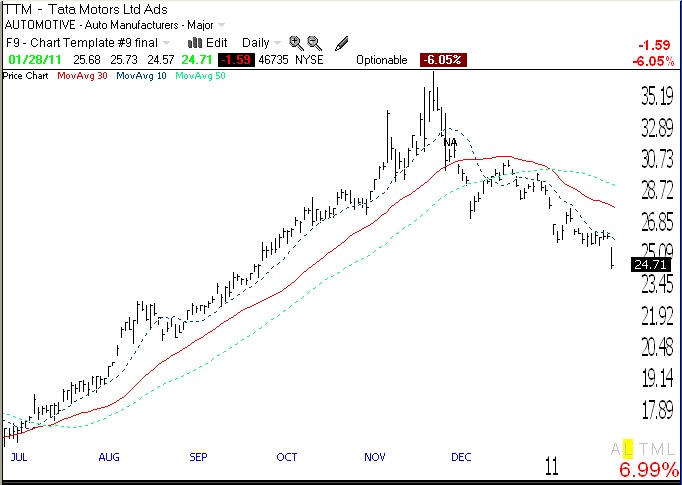 TTM subsequently peaked at $37.65 near the end of November and began a sustained down-trend, closing Friday at $24.71. Note on this daily chart (click on to enlarge) when TTM closed below its 30 day average (red line), which was a perfect sell signal. With the 30 day average now heading down, this stock is in a sustained short term down-trend, according to my definition. (It all looks so simple with 20:20 hindsight! Actually, it is if we just ignore the media noise and concentrate on the stock’s price trend.) This India automaker, was, perhaps, reflecting the impact of higher interest rates on consumer demand for cars. (But the putative rationale for the decline is not as important to me as the price action. The bad news usually comes out long after a stock has peaked.) I could short TTM, but I prefer buying put options this week on an India ETF or bank. The following India related stocks have closed below their 30 week averages and look ominous to me: INDY, PIN, EPI, IIF, IFN,INP,HDB, INXX.
By the way, I do not want to alarm you, but while the trend of India stocks looks the worst, it has plenty of company in the stocks/indexes of other countries, including China (CAF, CHIQ), Brazil (BRF), Turkey (TUR), Chile (CH), and Thailand (TTF). And I guess we should not omit Egypt (EGPT)…………
But the technicals for the U.S. markets look a lot stronger— for now. The GMI is 5 (of 6) and the more sensitive GMI-R is 7 (of 10). 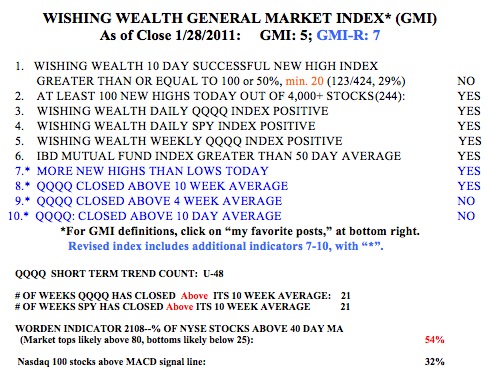 The GMI-R contains more short term indicators and can signal a change in trend earlier than the GMI. Both the short and longer term up-trends are intact, although the QQQQ is sitting right on critical short term support. A couple of down days this week could end the QQQQ short term up-trend, which completed its 48th day on Friday. The SPY and QQQQ completed their 21st week above their 10 week averages. When the QQQQ is above its 10 week average I am most likely to make money buying tech and growth stocks. A close of QQQQ below its current 10 week average (54.70) would signal to me to exit the long side of the tech market. The Worden T2108 indicator is in neutral territory, at 54%. A sign of short term weakness is the fact that only 32% of the Nasdaq 100 stocks closed with their MACD above its signal line……
So where do I stand with my accounts? My university pension remains 100% invested in mutual funds. I only exit them when my longer term indicators are very weak. However, my trading IRA and margin accounts are mainly in cash or a little on the short side. Fortunately I exited most of my long positions over a week ago when I became worried about the impending municipal bond crisis. While the pundits blame Friday’s market decline on the crisis in Egypt, those who have been following this blog understand that there are a lot of other reasons to expect market weakness. The very low percentage of advisers who are bearish (19.1%), the sudden selling in previously strong stocks (FFIV, CAVM, PANL, CREE, CTXS, APKT, AMZN) and the failure of AAPL and GOOG to go to new highs after their great earnings were released are especially troubling signs to me. With the end of 4th quarter earnings announcements, there may not be a whole lot to inspire stocks to advance over the next few weeks….
You may recall that IBD announced at the end of December that they were abandoning the IBD100 list published every Monday for the IBD50 list. During QQQQ up-trends I typically selected my buys from the IBD100 list. In past posts I have shown that the types of high growth momentum stocks that meet the criteria for inclusion on the IBD100 list typically outperformed Nasdaq100 stocks in an up-trending market but underperformed them during a falling market. This is because stocks that climb rapidly usually are abandoned quickly by traders when the market turns down. I analyzed the performance of the IBD50 list published on January 10, 2011, using the prior Friday’s close (1/7) as the starting point and going through Friday, 1/28. I found that during this period, 32% of the IBD50 stocks rose; 12% rose 5% or more, and 1% rose 10% or more (TSCO, +7.6% and NFLX, +21.6%). In addition, 10% declined more than 10%, with FFIV falling the most (-20.8%). The first stock listed in this IBD50 list, RVBD, declined -7.4%. In comparison, during the same period, 42% of the Nasdaq100 index stock advanced, 17% rose 5% or more, and 7% rose 10% or more. 4% declined -10% or more, including FFIV. The IBD50 list is designed to use more stringent criteria than the IBD100 list did. At least for this limited case and time period during which the Nasdaq100 index declined (-.25%), the IBD50 list apparently underperformed the Nasdaq100 stocks. I will replicate this analysis in the future with subsequent IBD50 lists.