GLD holds and T2108 weakens, getting more cautious

GMI5/6
GMI-R9/10
T210871%

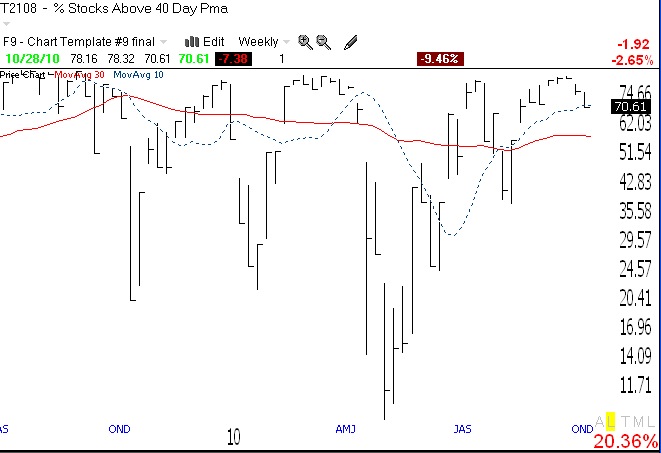
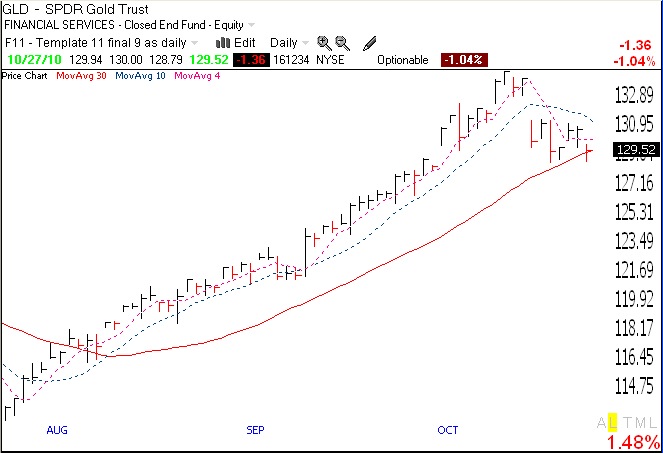
I was wrong on GLD–for now.   It actually bounced up off of support, giving me a possible buy signal. I closed out my puts yesterday.   Meanwhile, the Worden T2108 indicator is now down to 71%, lowest reading since early September.   See the weekly chart of T2108 below, click on chart to enlarge. The T2108 is a pendulum of the market, and when it starts down the market usually declines for a while. So, I am getting more cautious and ready to close out some positions at the first sign of real weakness in the leaders. With the GMI at 5, I am still holding on.

GMI declines to 5; GLD to weaken?

GMI5/6
GMI-R9/10
T210873%

The GMI declined 1, to 5, because my Successful New High indicator turned negative.   I am not concerned yet, but the T2108 indicator, at 73%, is also suggesting some weakening.   The QQQQ short term up-trend completed its 37th day on Wednesday………

I am watching GLD very closely.   It is right on support, and a down day   today could signal a short term down-trend in gold.   I bought some puts on GLD yesterday, when it was below support, but it closed back above support. Gold has had such a large uninterrupted advance since early August. Check out the daily chart of GLD below. (Click on chart to enlarge.) The 4 day average (red dotted line) is now below the 10 day average (blue dotted) and these two short term averages are now pointing down. A close below the 30 day average (red solid) would be a short term sell or short sale signal for me. GLD’s longer term trend remains up, in a classic Stage 2 up-trend on a weekly chart.