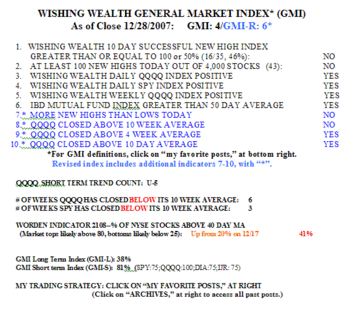
The GMI was 4 of 6 and the GM I-R was 6 of 10 as of Friday’s close. As this table shows, the indicators that rely on new highs have been pulling these indexes down. There were only 43 new highs and 158 new lows on Friday in my universe of 4,000 stocks.  (Click on table to enlarge.) Note that while my short term indicator, GMI-S, is at 81%, reflecting recent strength in four indexes, the GMI-L is at 38%. This pattern reflects a short term rally in indexes that are weakening for the longer term. This is very ominous. Note the QQQQ has closed below its 10 week average the past 6 weeks and the SPY for 3 weeks. More significant, the 10 week average is below the 30 week average for the SPY, DIA and IJR. Only the QQQQ, a tech index without financials, is relatively stronger.
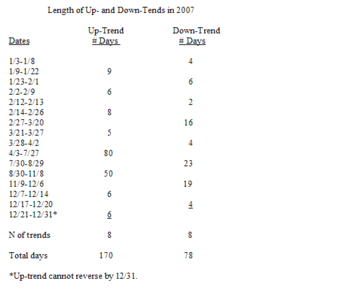
The difficulty trading the recent market is reflected in this other table. I broke the trading days in the past year into whether the QQQQ fell into up- or down-trends according to my posts this year.  There were 8 up-trends and 8 down trends in 2007. For swing traders like myself who like to hold stocks over weeks or months, there were only 2 tradeable rallies, lasting 80 and 50 days. The remaining 6 up-trends lasted 5-9 days. On the other hand, there were 3 relatively brief tradeable down-trends, lasting 16, 23 and 19 days. Since December 7, trends have whip-sawed back and forth. No wonder it has been difficult to make money in December! Note also that for 2007 as a whole, the market was in an up-trend about twice the number of days (170/78) that it was in a down-trend. The year 2006 had an 86 day up-trend. These stats reinforce the idea that traders must jump on these long up-trends when they appear, once or twice each year.
New email: ewish46@gmail.com


