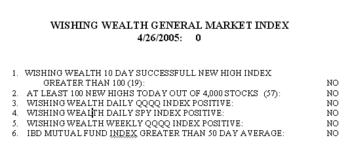
Aren’t you tired of fighting this market? I think it is time for us to work on a general market index that summarizes the indicators I use to monitor the general market trend. Keep in mind that I am a chicken and have successfully dodged the 98 bear, the 2000-2002 bear and most of the present decline. I put together the Wishing Wealth General Market Index above (click on it to enlarge). It counts the following elements:
1. Wishing Wealth 10 Day Successful New High Index Greater than 100. I follow a “universe” of almost 4,000 actively traded stocks that were $5 or over several months ago. I use TC2005 to count the number of these 4000 stocks that hit a new 52 week high 10 days ago and closed today higher than they closed 10 days ago when they made their highs. In a rising market, traders have the confidence to let strong stocks climb, so they have a successive number of new highs. In a bad market, anxious traders take profits quickly and stocks tend to gyrate. I have only been computing this index since last March, when I had a count of 106. I am suggesting that any number above 100 will be a bullish sign. However, I reserve the right to change this threshold as I gain more experience with it.
2. At least 100 new highs in a day in my 4,000 stock universe. In a good market we should at least have 100 stocks hitting new highs. Furthermore, when a market has more daily new lows than new highs (as the current market does), we really should not be buying growth stocks with the expectation of making a profit. The odds are simply against us.
3. Wishing Wealth Daily QQQQ Index Positive. The QQQQ tracks the 100 largest non-financial stocks in the NASDAQ. I watch the QQQQ to track the tech stocks, and often trade it or its options. This index is positive when my technical indicators suggest that it is in a rising trend. (You don’t really expect me to disclose how I do that, do you? You would never visit me again.)
4. This index is similar to #3 above, but is a daily measure of the SPY, an index that tracks the S&P 500 index. The SPY is another useful way to buy or sell the market and is an excellent indicator of the general market trend.
5. The weekly QQQQ index is the same as #3 above but is based on the weekly trend. A change in trend will occur in the daily indicator before the weekly indicator. In a strong market both the daily and weekly trends will be positive.
6. The IBD Mutual Fund Index comes from the Investor’s Business Daily (IBD) newspaper. A chart of this index appears in the mutual fund section. To be positive, this index must be above its 50 day moving average, shown daily. Update: IBD no longer publishes the 50 day average in the graph in the paper or online edition. IBD subscribers can get the full chart by typing in 0muti in the charting function on the IBD home page. I have found that when these growth mutual funds are rising, then I can expect to successfully buy growth stocks. (Don’t take my word for it. Go back and see how this index relates to your trading success.)
The Wishing Wealth General Market Index just counts the number of these conditions that are positive. The index is 0 today. I will continue to track these indicators daily and publish them on the blog. I hope that they will be as useful to you as they have been to me. With a zero reading, I will not waste our time talking about stocks to buy. A better use of our time would be to discuss stocks to short.
Thank you for creating and sharing this index with us. I look forward to monitoring it in the future.
Wonder of Wonders, something that actually makes sense to me.
Thanks.
Not sure if previous email I just sent got to you………Looking for your buy and sell dates of GMI going back to 2000……How can I get those dates ????………….Thanks………..rc…….
Well, it’s me again !!! Still trying to find those buy and sell dates for GMI going back to 2000……….Thanks much for your help…………Looking forward……………Rc…………
What for?
I use Vanguard and TRPrice funds and follow the standard Seasonality buy and sell dates using MACD to time entry and exit………….Would like to compare the results of your setup ………….Thanks……………Rc…..
Dr. Wish,
The GMI definitions mention QQQQ, but I can’t find any QQQQ. Is this a typo or has the symbol changed to QQQ since 2005 when these definitions were published?
Thank you!
QQQQ is now QQQ
Why isn’t a historical record of GMI numbers available somewhere on this site?
Dr. Wish, I am inspired by your blog have been following it for approximately 5 years since I heard you at an AAII seminar. You mentioned a possible non credit course for adults, and I would be extremely interested in taking it.
Thanks for your wealth of knowledge! Diane
Great resource! Your site is on my daily watchlist.
Hello Dr. Wish, I would like to ask you how you define your “universe” of stocks for the calculation of the first and the second component indices of the GMI starting from the US common stocks List.
Thank you! Giuseppe