When I get a new QQQ short term down-trend I buy a little SQQQ. It is a low risk trade because if the down-trend ends quickly I will have a very small loss. In the past, 40% of new QQQ short term down-trends ended within 5 days. If this one reaches day 5, I will add more SQQQ. If a new up-trend begins I will exit SQQQ and buy TQQQ. Note that on a day when the Dow rose 600+ points, there were only 17 US stocks reaching new yearly highs. I like to watch the new high list during market declines because that is where the new leaders will first show up. It is much easier to spot them when there are very few new highs.
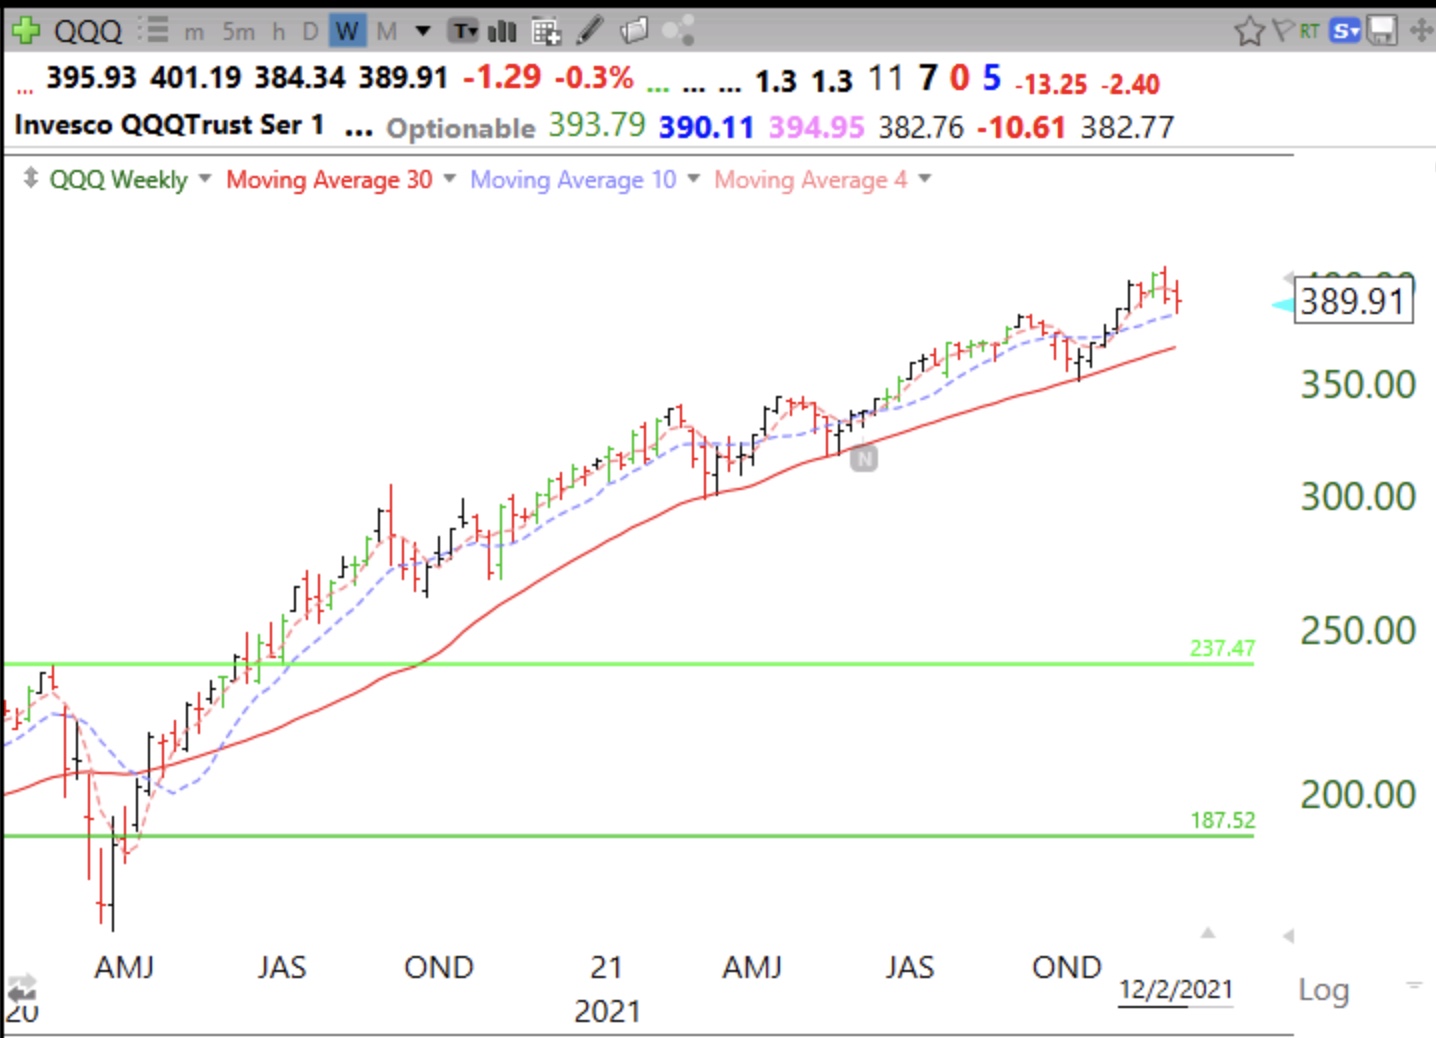
Note that the GMI=1. If the final component turns negative and GMI=0, I will start to transfer my university pension money out of mutual funds. My trading IRA is still almost all cash. We are a long way from QQQ closing below its 30 week average (red line in this weekly chart) which is the final positive GMI component. QQQ is at 389.91 and its 30 week average is at 366.04. For now, QQQ remains in a longer term Stage II up-trend. Note how many times QQQ has found support at its 30 week average. The only exception is the brief 2020 decline. The put/call ratio and T2018 are not in major bottom territory yet, so this decline likely has further to go.
newbie here. What is GMI?
I found your article from 2009 that explains GMI