Since the start of the current $QQQ short term up-trend on 10/18 there have been more new highs than lows each day until the past 2 days. I think this could be a danger sign. The past 2 days only 34% and 27% of US stocks closed higher. Something is up.
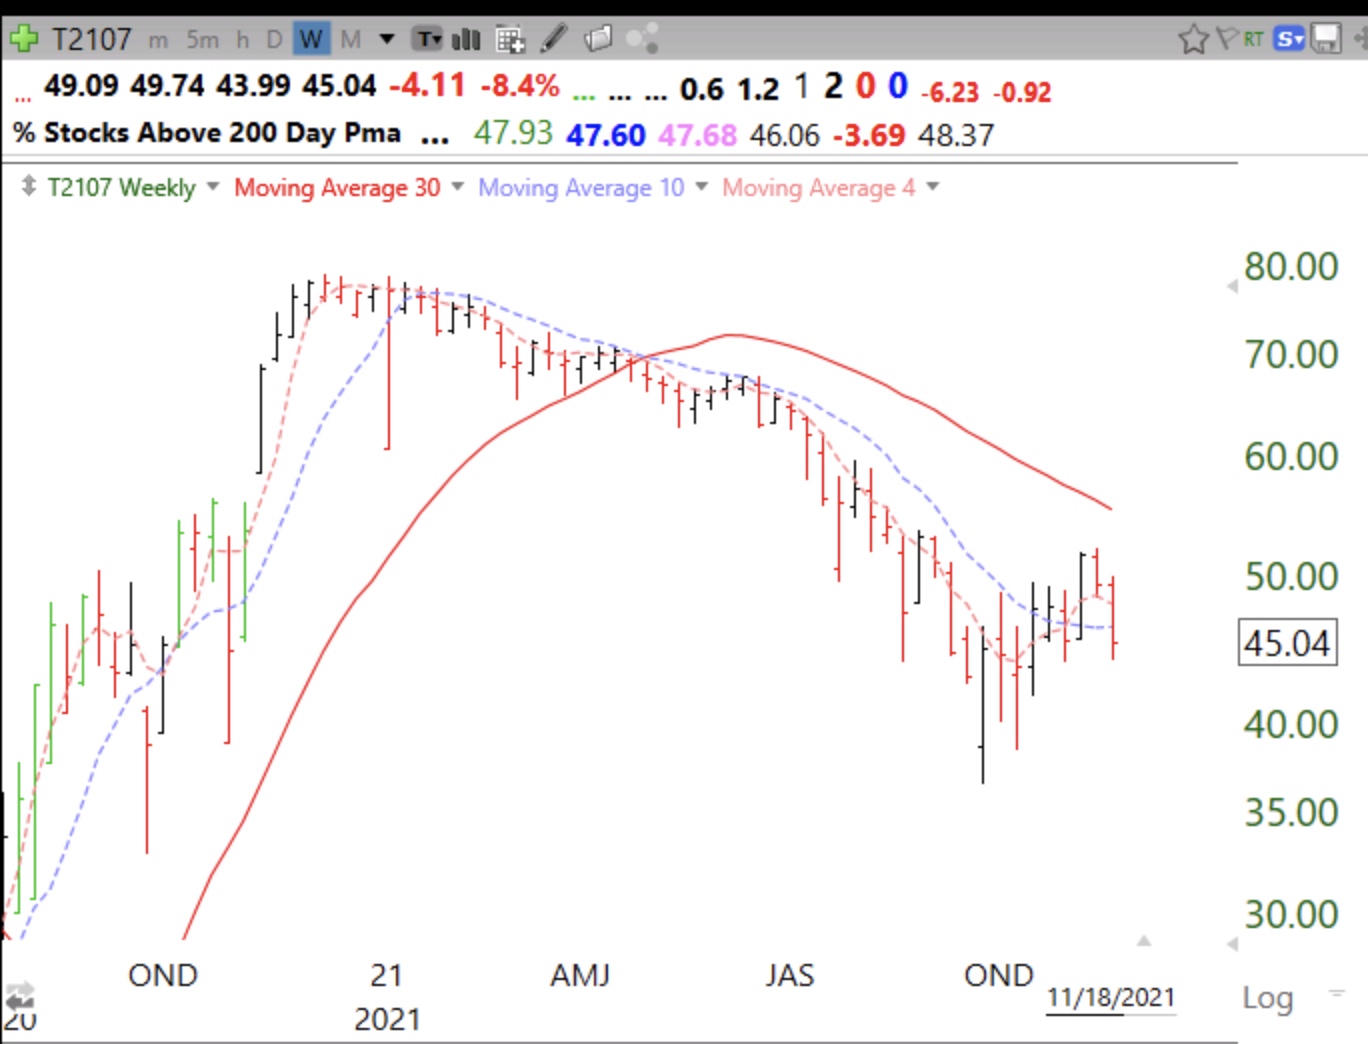
This weekly chart shows that % of stocks above their 200 day average is declining.