From my blog:
Glossary
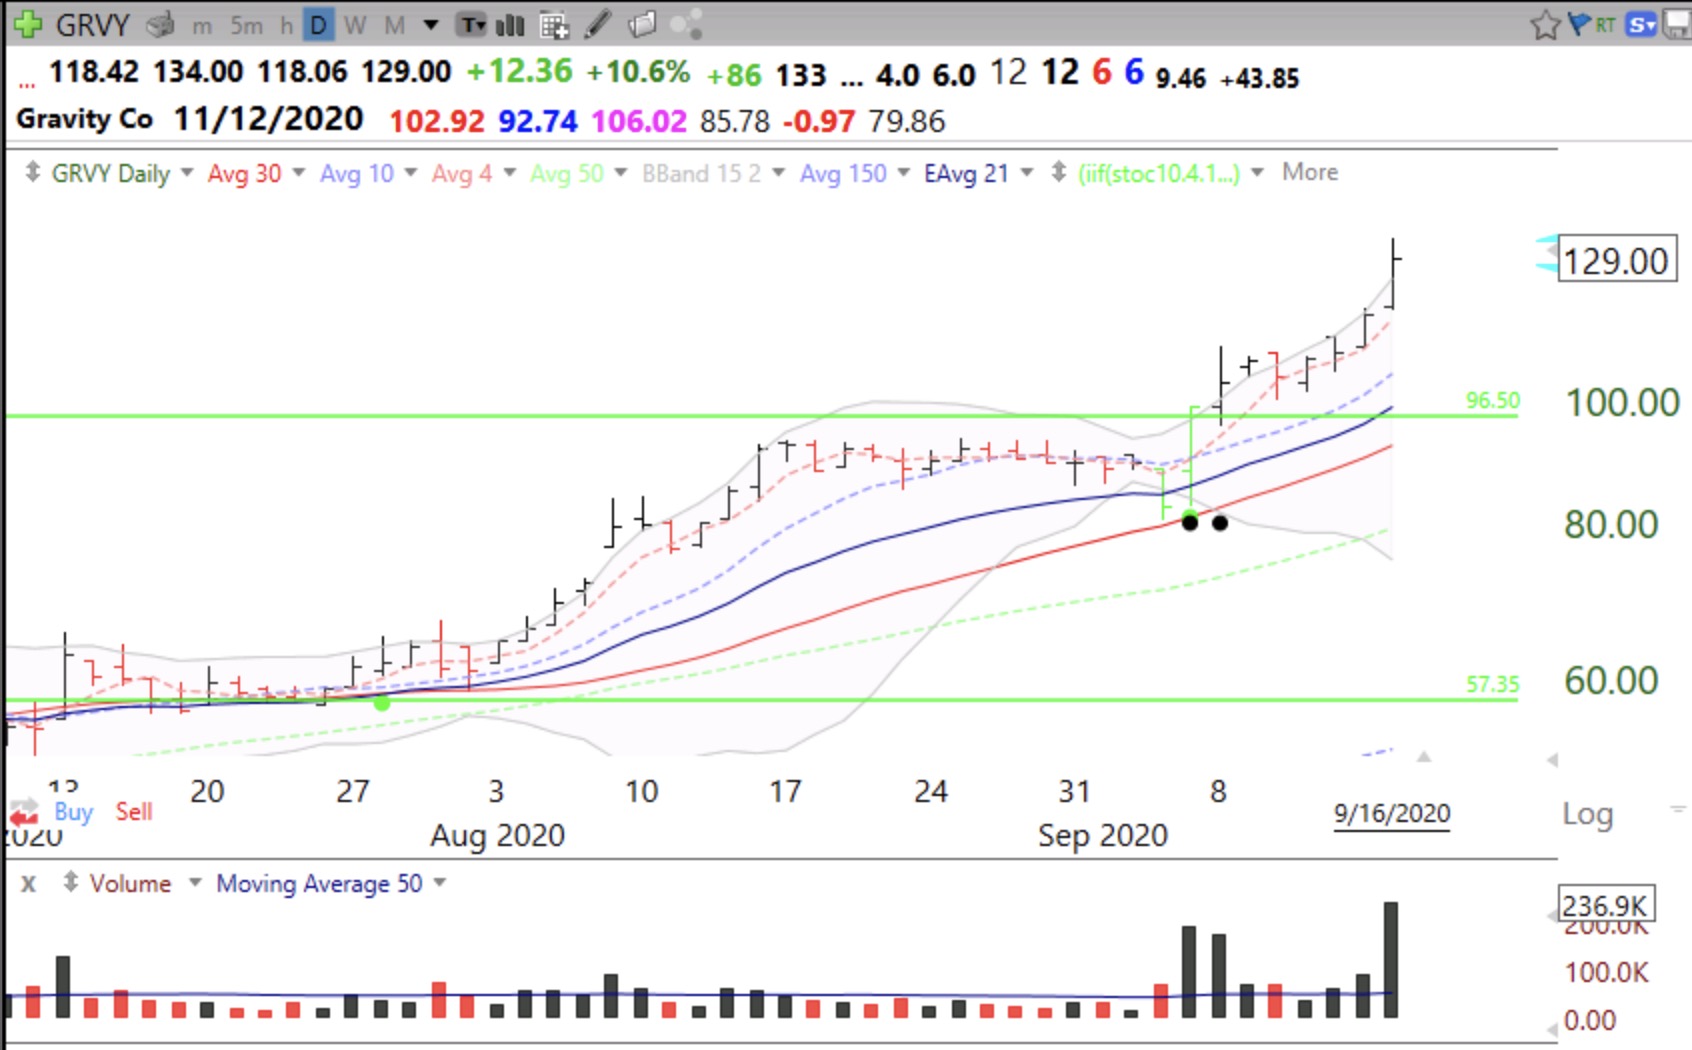
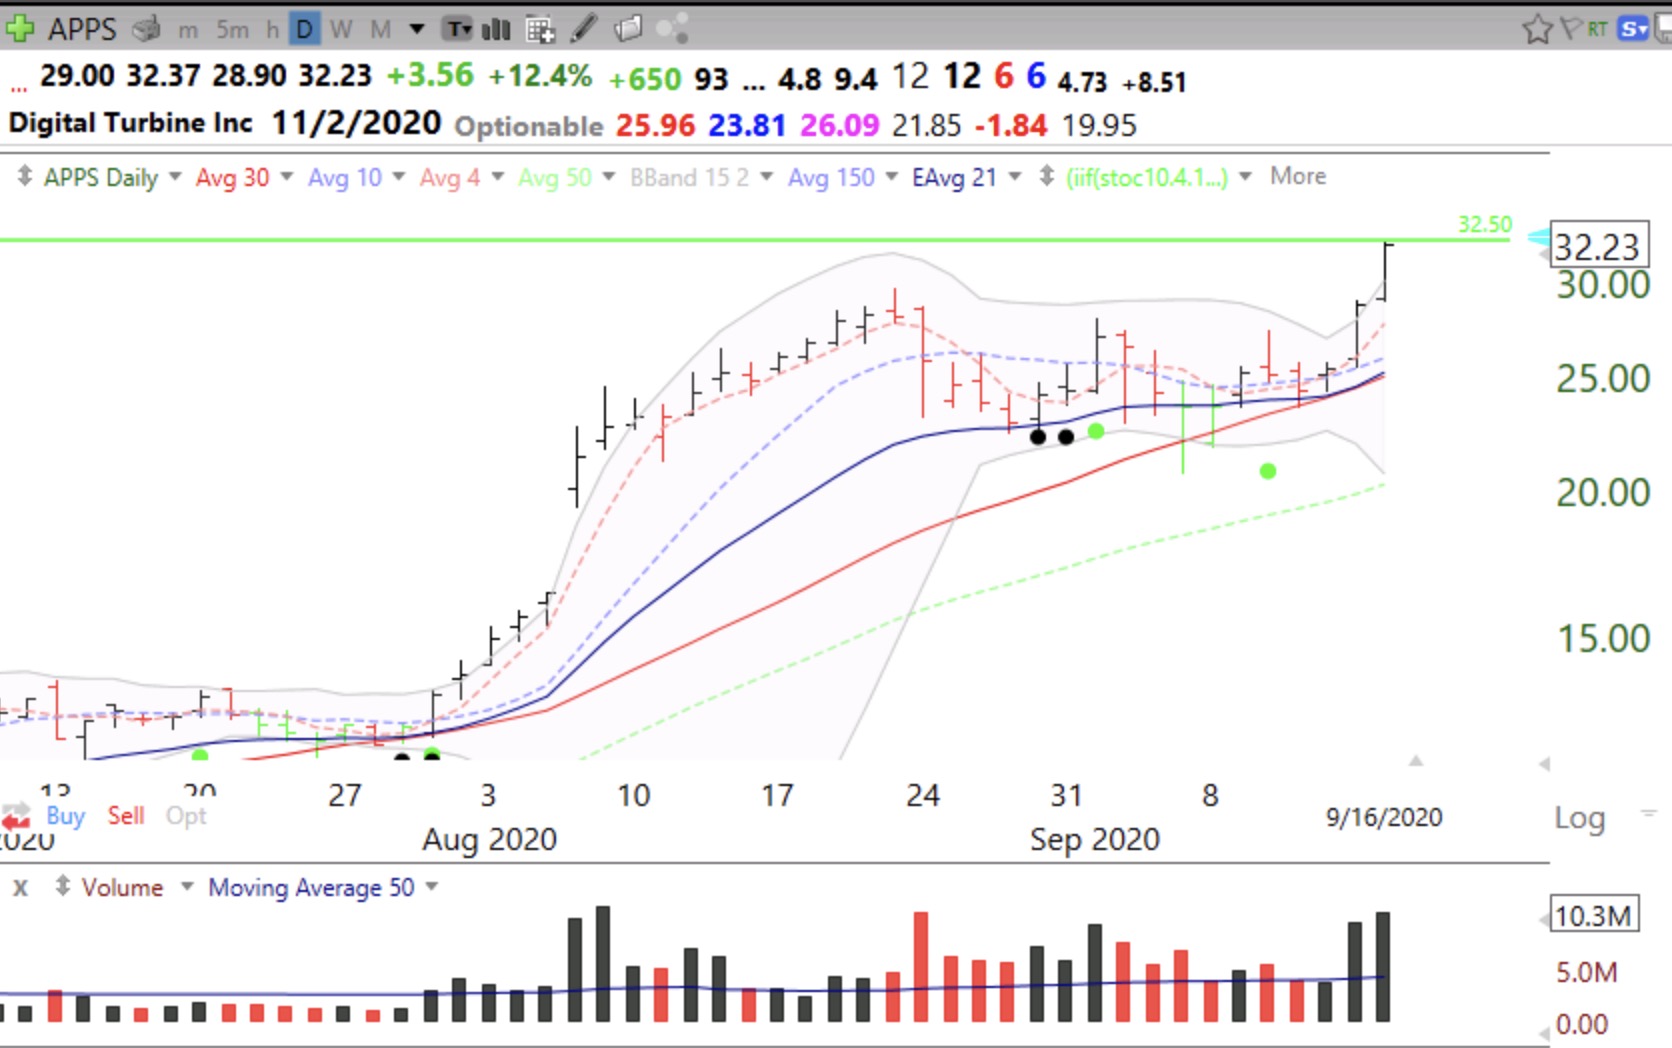
Green Line Breakout (GLB)
I draw a green line on a monthly stock chart at an all-time high that has not been penetrated (or closed above) for three straight months. It generally is a good indication of a stock breaking out of its all-time high after minimum of a 3-month consolidation. Green line breakout stocks, in my experience, often go on to make a series of new highs as they rocket toward the moon.