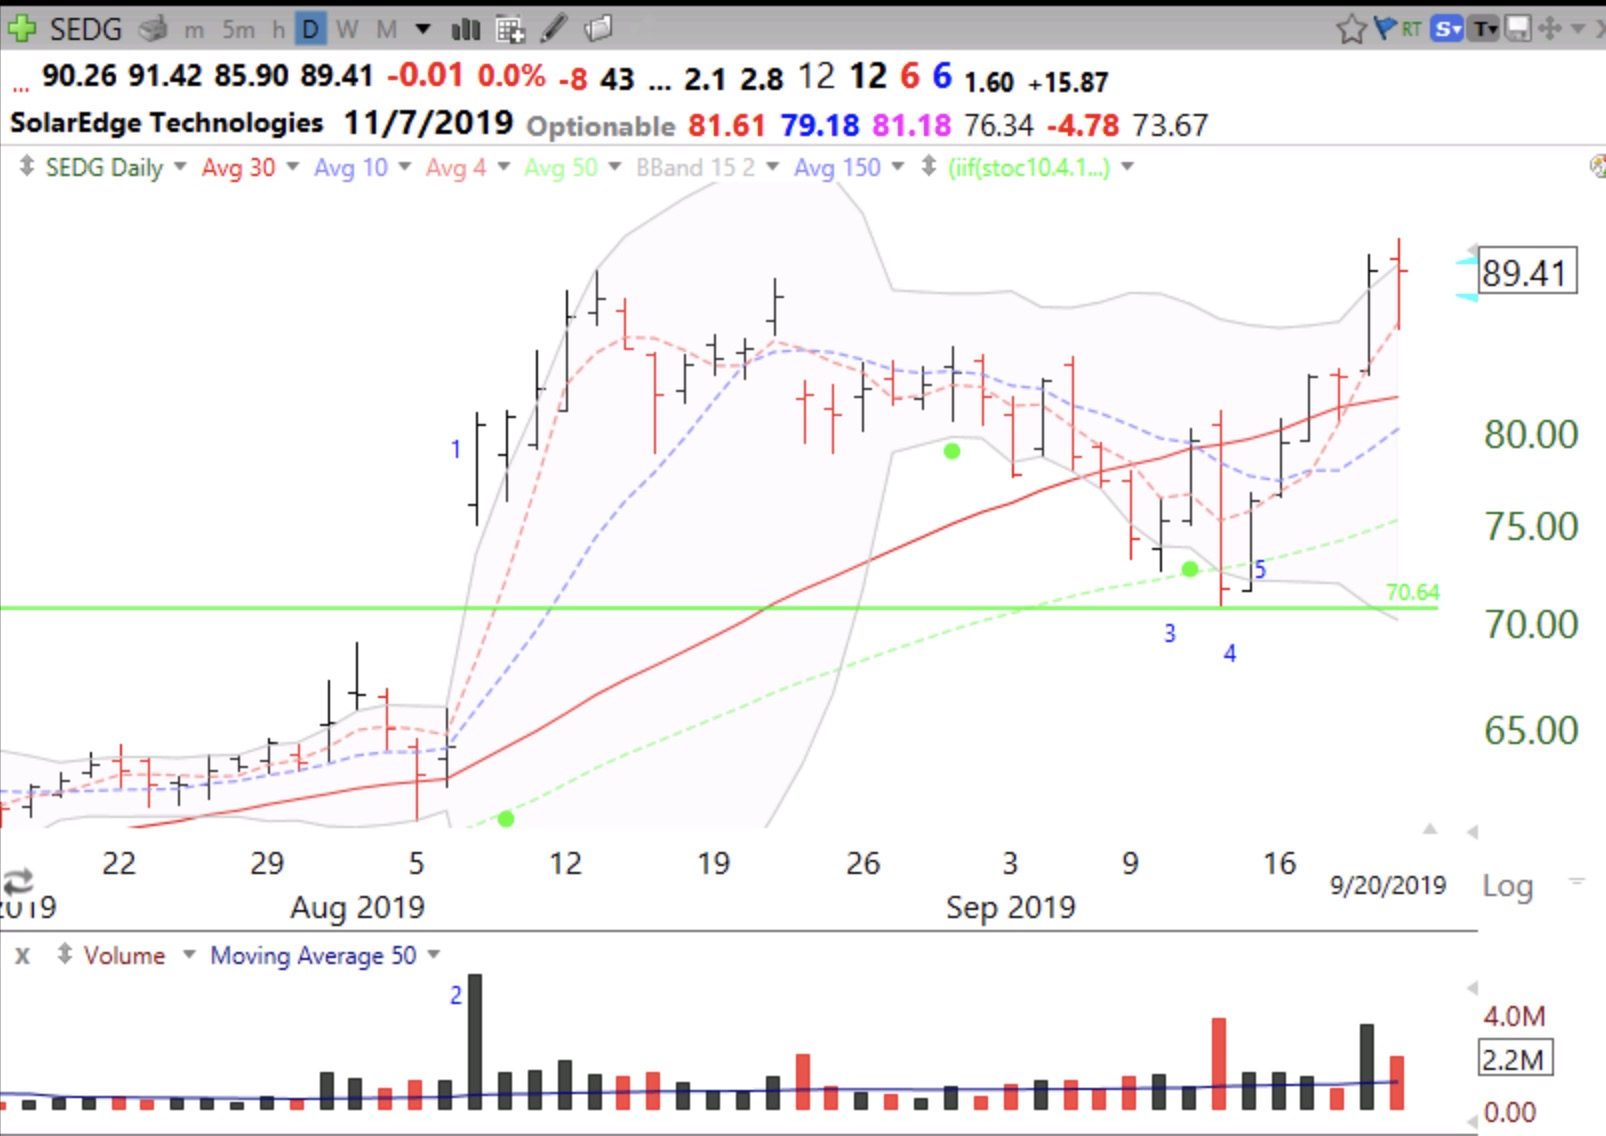
My star pupil from last year who is a TA for my current class alerted me to the recent GLB for SEDG. You can see Richard’s youtube videos based on what he learned in my class here. I have annotated this graph of SEDG highlighting some key points: 1- the GLB; 2-Above average volume on break-out; 3-Green dot signal; 4- Re-test of GLB; 5- bounce off of the lower 15.2 Bollinger Band.
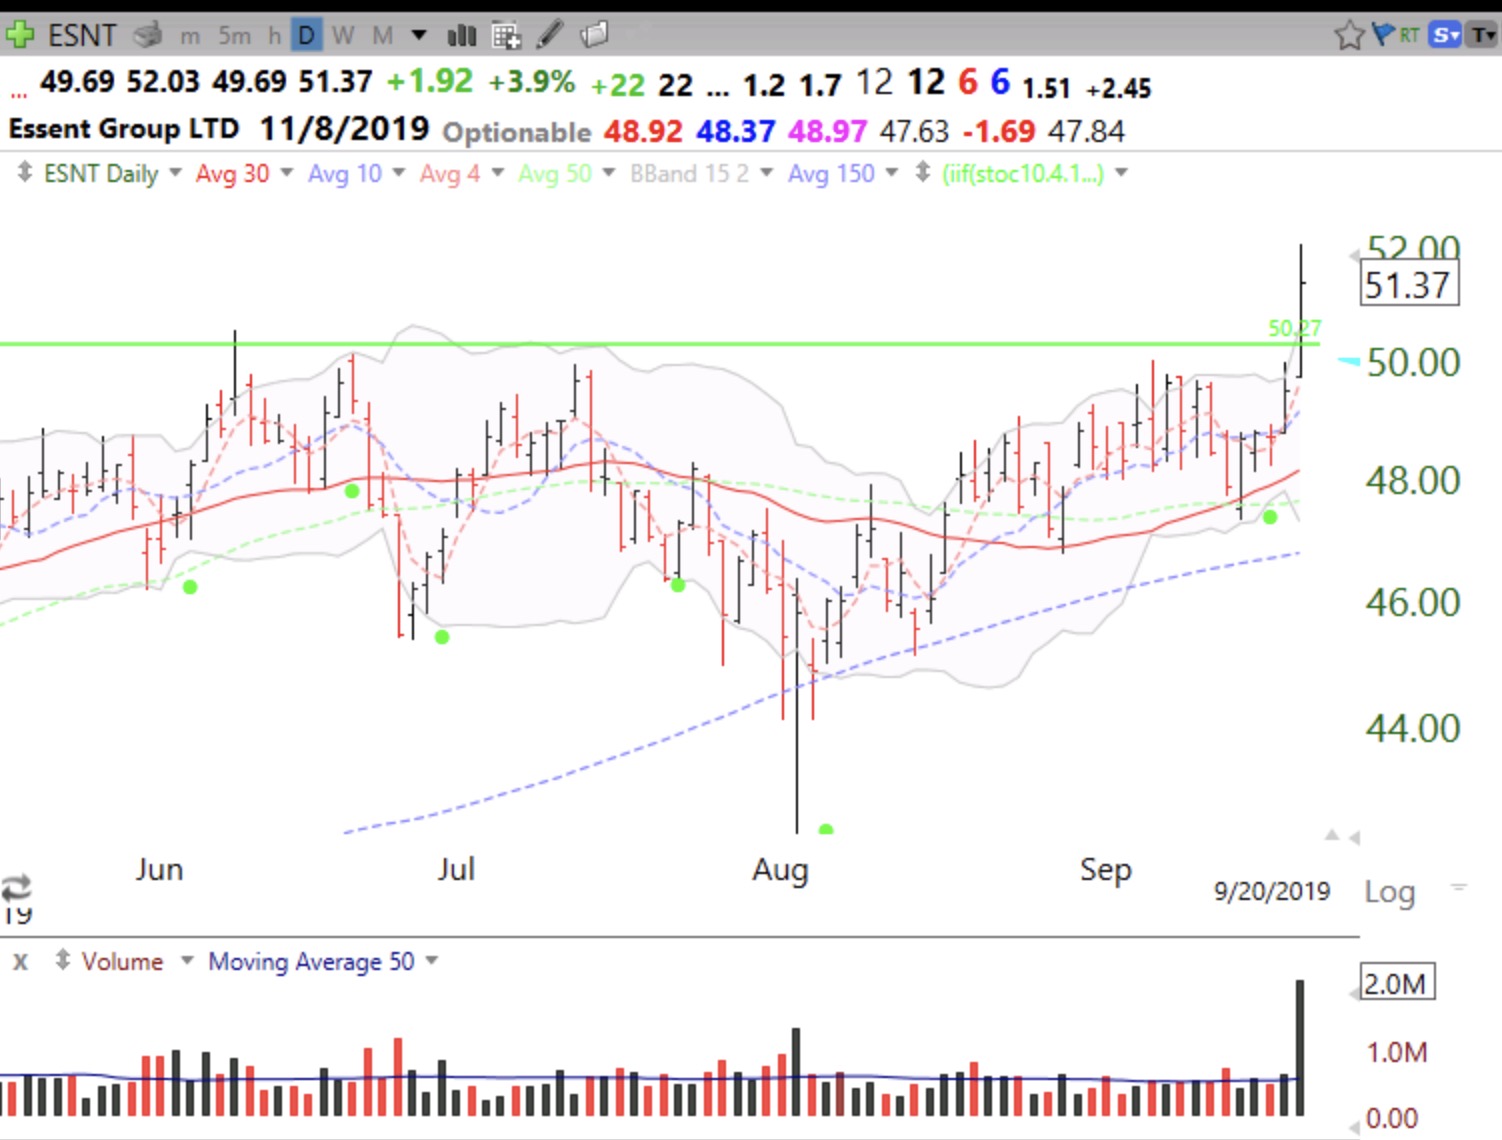
ESNT had a high volume GLB on Friday after a green dot signal after bouncing up off of its lower Bollinger Band.
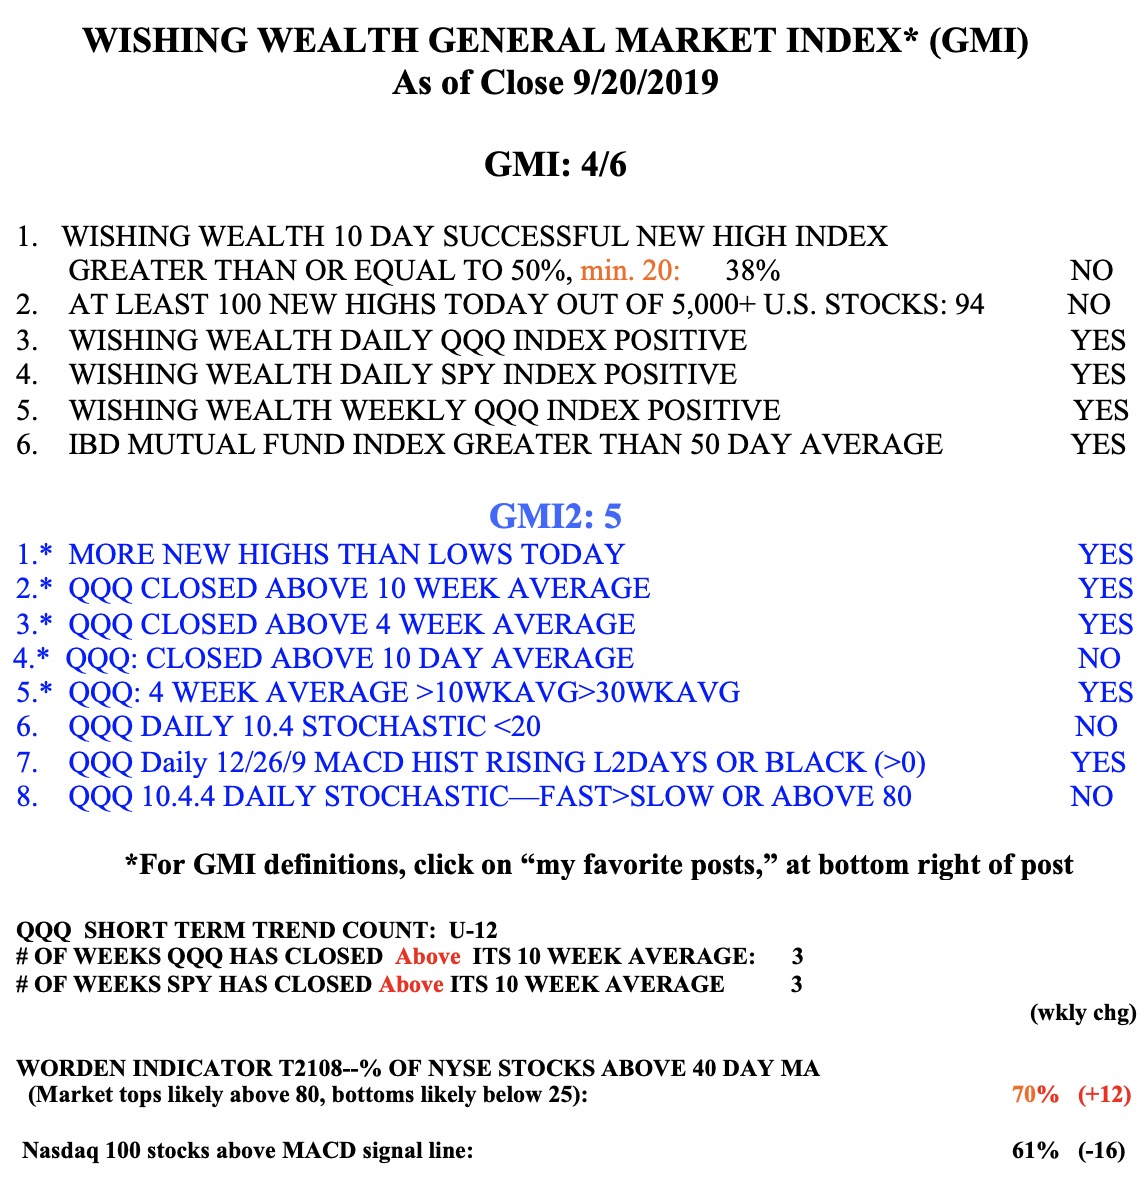
The GMI remains on a Green signal. The stronger stocks the past few weeks may get an extra push up this week from end of quarter mutual fund window dressing.