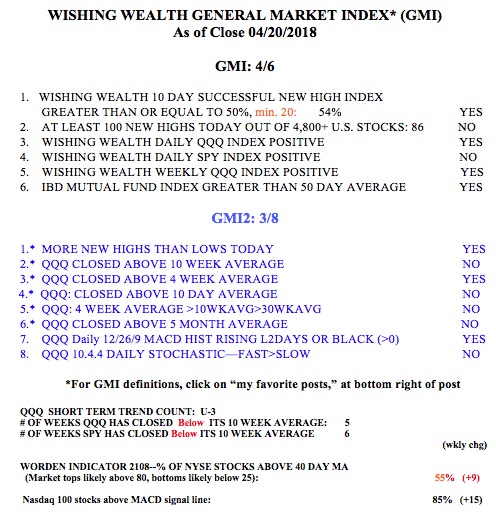
The current earnings report season is supporting this market while rising interest rates weigh it down. What happens after earnings season is over in a few weeks? Sell in May? The GMI2 is at 3 (of 8), indicating that only 3 of my very short term indicators are positive. A weak close of the QQQ on Monday could turn the QQQ short term trend count down after only 3 days of a new short term up-trend. I know that I timidly went to 100% cash early without waiting for the indexes’ 30 week averages to turn down. Was I wrong to exit? The jury is still out….
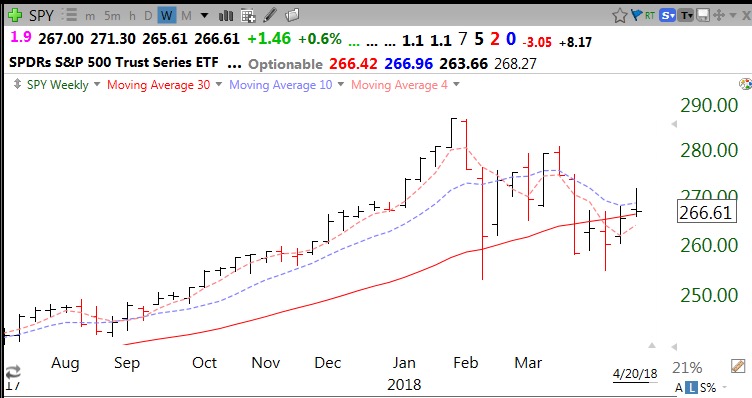
This weekly chart shows that the SPY is sitting right on its still rising 30 week average (red solid line) but below its 10 week average (blue dotted line). A close back below the solid red line would indicate to me considerable technical weakness and that a possible Stage 3 top is forming. Note the 4 week average (red dotted line) is below the 30 week and 10 week averages. Compare this to the pattern from last September through January, when the 4wk>10wk>30wk average, the pattern of a sustained up-trend (component #5 in GMI2) when holding stocks or index ETFs was likely to be profitable. When that pattern comes back I will be comfortable getting back into the market in my university pension and my trading accounts. (No, I never get in at the bottom, only after I think one is in place—the fate of a trend follower.)
How do the bars work on your chart? The last day was a down day but the bar is black not red. thanks.
better out wishing you were in than in wishing you were out.