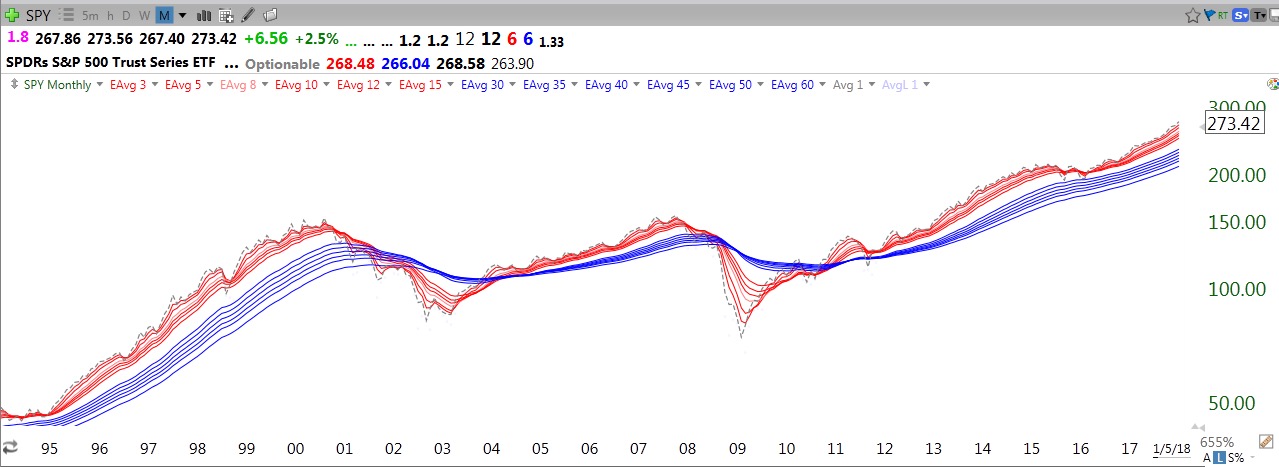
This monthly RWB chart of the SPY since 1994 shows what the 2000 and 2007 bull market tops looked like. It is clear that the market remains in a strong up-trend until the red lines (shorter averages) decline and the RWB pattern disappears. The current market, as measured by the SPY, remains in a clear RWB monthly up-trend. Stay tuned….
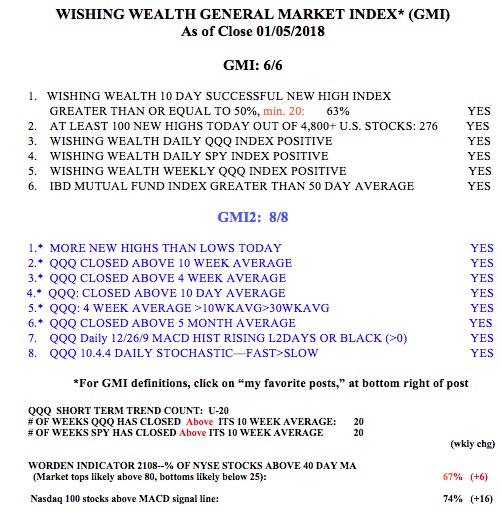
The GMI remains at 6 (of 6):