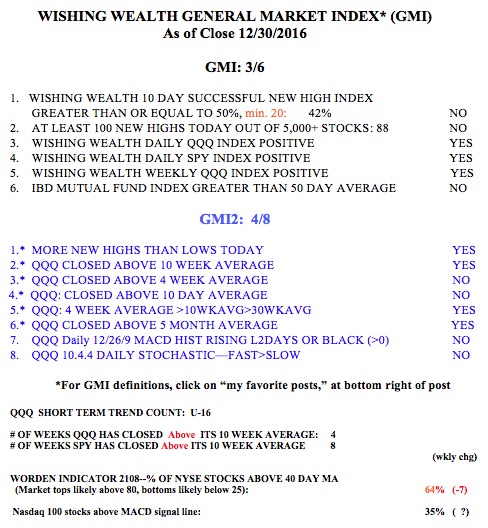
With the GMI weakening to 3 and its short term up-trend in jeopardy, the general market faces a critical test this week. The QQQ short term up-trend has completed day 16 but is on the verge of turning negative.The averages are oversold and today’s futures predict a strong bounce at the open. So the market may move back from the edge of the cliff.
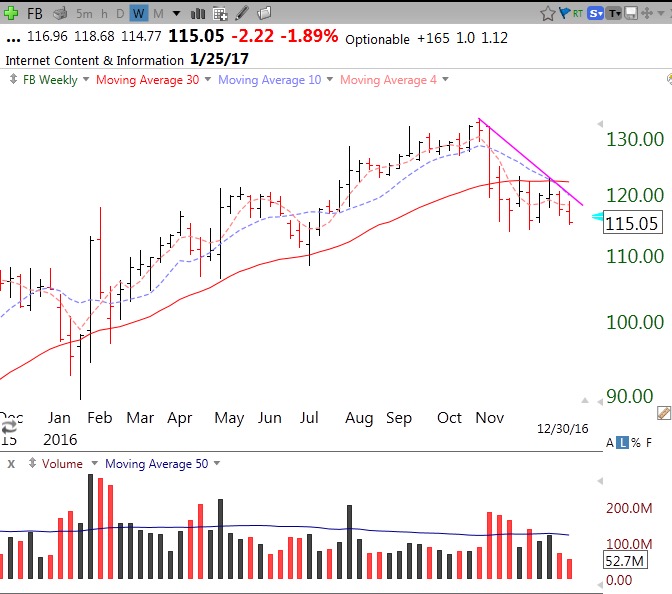
NVDA’s buying climax and reversal last week gives me pause for thought. They generally shoot the leaders first before the rest of the troops. I am also concerned with the weak chart of a former leader, FB. Here is FB’s weekly chart. If I wanted to short a stock this might be a good candidate. Note that FB is below a level (topping?) 30 week average, suggesting a potential Stage IV decline. And there were several weeks of high volume selling in November. Its 4wkavg<10wkavg<30wkavg, a weak pattern. If it pops this week, FB could present a fine set-up for a longer term short with a put option.
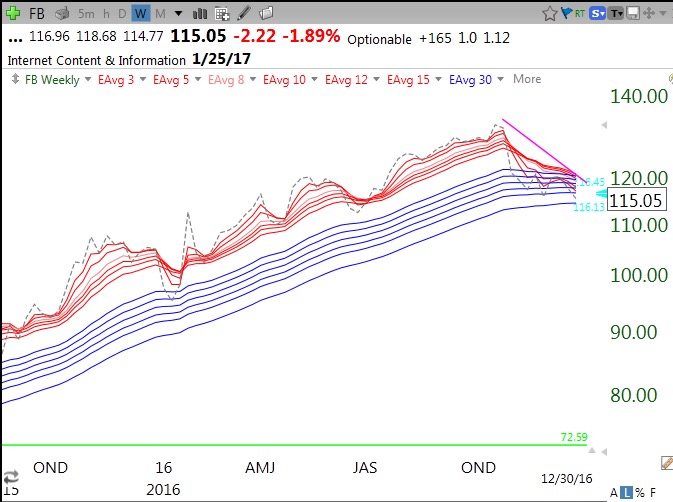
While FB’s RWB pattern is gone, it has not yet formed a BWR submarine pattern and has an RWBCount=6 (of 12). I am watching for a close below the lowest long term (blue) average, currently at 114, to suggest a potential BWR pattern. A close above the top average, at 120.49, would negate this bearish pattern. Note FB reports earnings on 1/25, which could trigger a large move.
The GMI and GMI-2 have weakened but the QQQ short term up-trend count could continue with a significant up day on Monday, with a close above 118.86. 2017 should be an eventful and challenging year for all of us traders–like every year!


