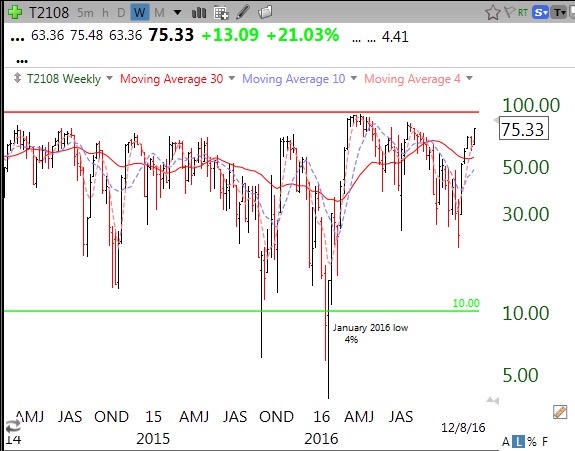
All of my GMI and GMI-2 indicators are positive and the QQQ short term trend is now up. The QQQ short term trends have been going back and forth between up and down very quickly. But the longer term trend measured by the GMI has been Green since November 10. One note of caution is the high value of T2108. This pendulum of the market goes from overbought to oversold. (T2108 measures the percentage of all NYSE stocks that closed above their 40 day moving average of price.) Now at 75%, the T2108 is at the highest level since last July, five weeks before the SPY topped out. See the weekly chart of T2108 below. T2108 is entering nosebleed territory.