Please note that my QQQ short term trend indicator is much more sensitive than the GMI and I may use it to trade a short term up-trend within a longer term down-trend, like we have now. I have found that if a new QQQ short term trend can last for 5 days, it often has legs. When a trend changes from down to up, it is very difficult to accept it because there has often been a long down-trend prior to the change. We all have our hands on the rear view mirror as we try to navigate the market (and life!). I sometimes buy the leveraged 3X QQQ bullish ETF , TQQQ, on the first or second day of a QQQ short term up-trend and try to ride the up-trend. Short term up-trends, once they reach 5 days, can often persist for many days, the majority go on from 11-44 days, based on an analysis I did of trend changes between 2006-2013. So, I may buy some TQQQ at the beginning of a QQQ short term up-trend and average up slowly if the trend continues. But right now the GMI is on a Sell signal suggesting that if this short term up-trend should fail, it could come down in a hurry. I therefore wager very little money on such counter-trend bounces. (Don’t ask me to define little or how I average up, it depends on one’s personal account size and tolerance for risk.)
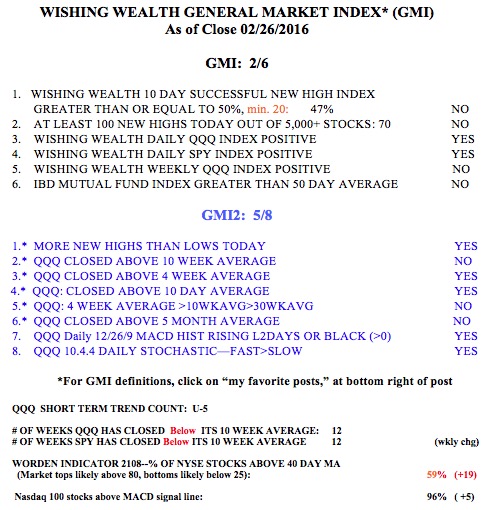
But I am growing more confident of the idea that this market has put in a bottom that will last for a while. There is too much open bearishness on the internet and CNBC shows. Plus the T2108 hit an extremely low reading of 4% during the January decline, a level that is very rare and typical of past market bottoms. The weekly 10.4.4 stochastics indicators for the QQQ and SPY and DIA are also at oversold levels not reached since 2013. Finally, the Investors Intelligence poll published in IBD continues to show more investment letters being bearish than bullish, itself a very rare phenomenon. Typically bulls far outnumber bears for very long periods, and when the reverse happens, the market fools most prophets by going up.
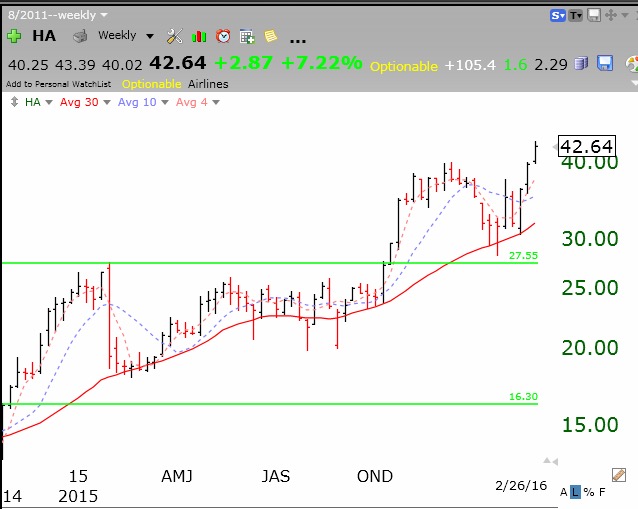
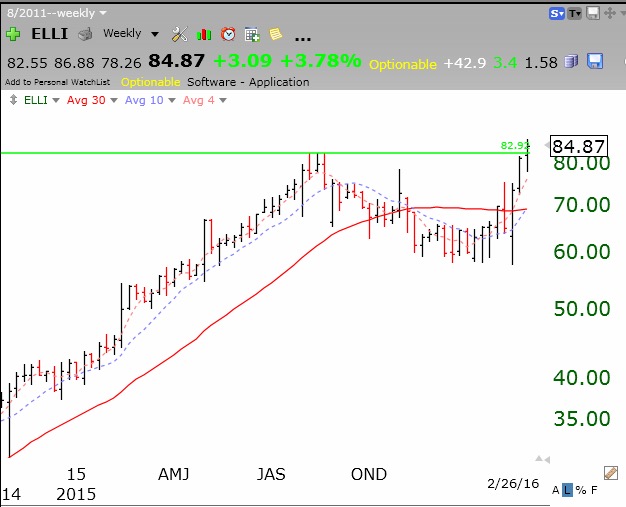
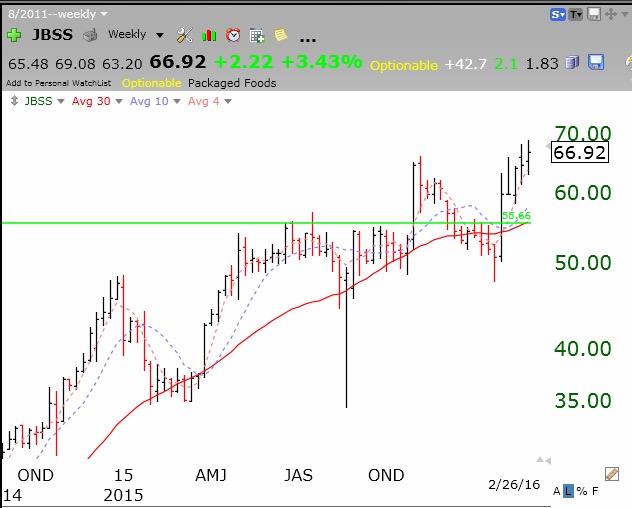
The GMI takes a long time to reverse and with the major indexes still trading below their 30 week averages, the coast is not clear yet. But a major reversal has to begin with a change in the very short term trend, and that has happened, for now. I therefore remain largely in cash, but I am tiptoeing in with small purchases of TQQQ and a few other strong stocks. There are a number of stocks showing some technical strength, which I am putting on my watchlists to monitor and research. Any stock that can come through the recent declines at or near its all-time high is showing strong buying interest by others. Here are a few, most of which have had a recent GLB (green line break-out to an all-time high):
HA:
ELLI:
HOFT:
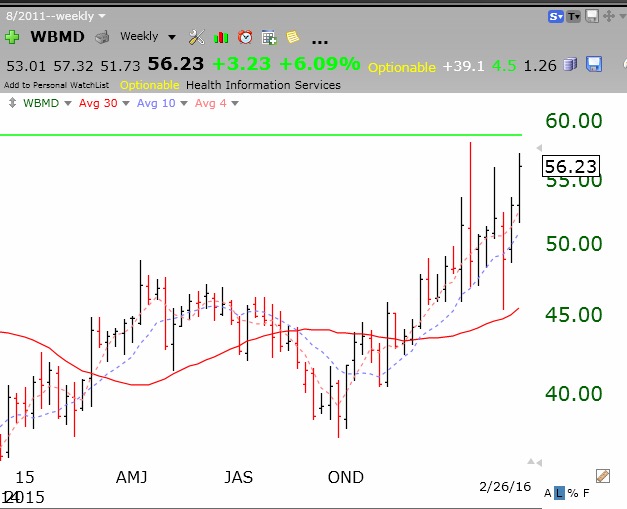
 WBMD is heading towards a GLB, but must prove its ability to break through.
 JBSS:
JBSS:
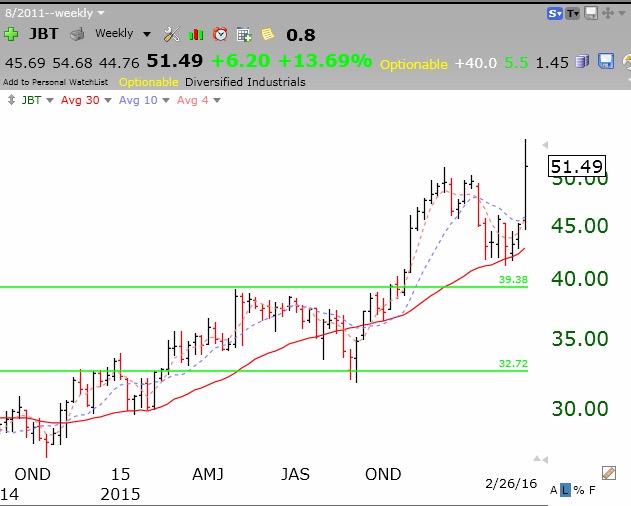
 JBT:
JBT:
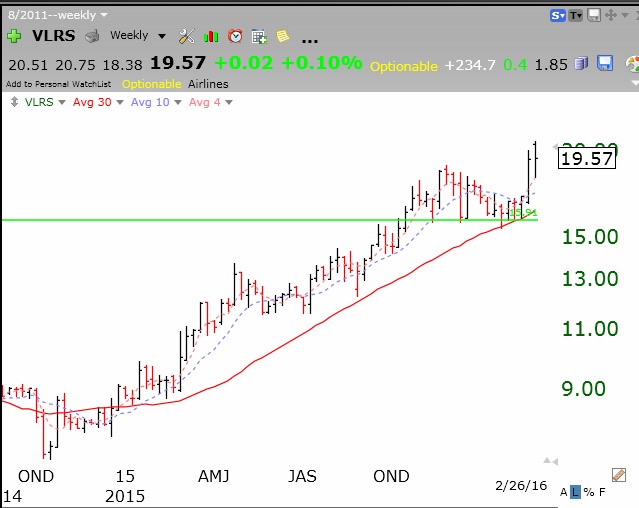
 VLRS:
VLRS:
One or more of these stocks may turn out to be a real market performer, but the GMI remains at 2 (of 6) and on a Sell signal since December.
Dr. Wish,
How do you Characterize the start of a QQQ short term up-trend, is it by what you call the GMI-2 or is it a different indicator, I appreciate an explanation.
Thank you
The QQQ short term trend count is based on a separate indicator I follow.