I have found that since 2006, the GMI has done a good job of keeping me on the side of the general market trend. It is my cardinal rule to trade consistent with the market trend. While the GMI has helped me to exit the market in prior major declines, I have discovered an important limitation while examining GMMA charts. From the GMMA chart of the QQQ below, I can see that since early 2014, the GMI has issued 7 separate Sell signals (red arrows) followed by 7 Buy signals (green arrows). However, during this entire time the QQQ has remained in a strong RWB up-trend, with all of the shorter term averages (red) above the rising longer term averages (blue)!
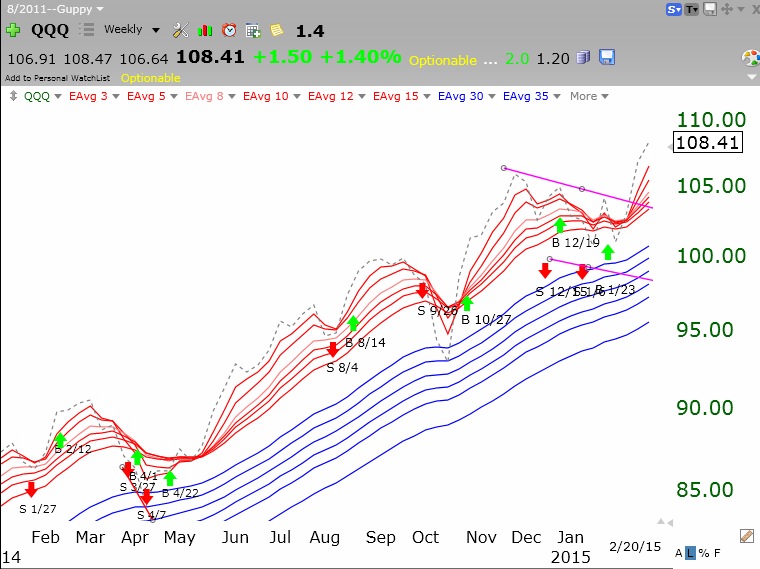 It is clear to me that a GMI Sell signal should only be used by me for short term trading decisions. Last week I posted that prior major market tops have been signaled when the shorter averages declined below the longer term averages. I should therefore probably remain invested long term in the market (at least in my university pension account) as long as the RWB pattern is in place, even when the GMI signals Sell. I am reinvesting my pension funds back into mutual funds. In the future I will use the GMI signals only to guide my shorter term trading in my more speculative accounts. I will heed the GMMA chart for longer term trends. One must never stop learning and adapting when it comes to the markets….
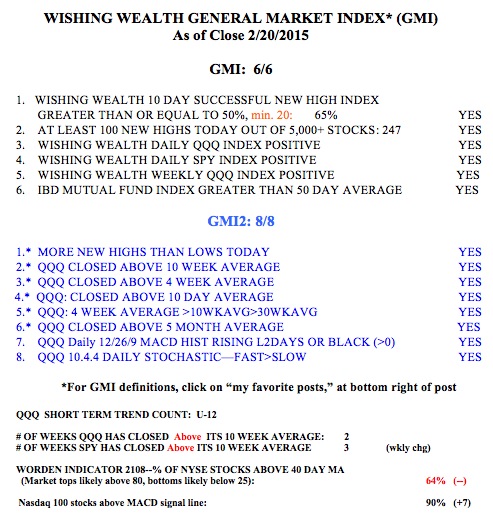
The GMI remains at 6 (of 6).
Dear Dr. Wish,
I wonder if you could shed some light on something.
I set up a GMMA chart in http://www.freestockcharts.com/ with the correct MA’s, but mine doesn’t look like yours. For instance in mine between 10/10/14-11/10 the red shorter averages are well below the blue.
Am I doing something wrong?
I noticed yours say EAvg3..etc. What does this mean?
Thanks!
here’s a link
GMMA
Changed to EAvg.
Still doesn’t look like yours though.
here’s another link.
http://www.freestockcharts.com?emailChartID=d1724fd2-03f0-44c2-a0d8-175d6db520aa
Am I doing something wrong?
Thanks!
Makes sense. Different tools for different time frames.
GMI is good for timing short term trades. This is exactly what someone had mentioned a while ago in the comments section.
Scott,
You’re using a daily chart whereas Dr. Wish uses a weekly chart.
Ah!
Excellent.
Thank you!
Great adjustment.
I see weekly short term MA listed. But what are the exact long term MA being used please. Thanks.
taking a quick look over the history of both NDX and the SPX, using the simple rules:
“buy when all the short emas are greater than all the blue emas”, and
“sell when all the short emas are below the blue emas”
doesn’t really give very impressive results (still have some big drawdowns), so again I would expect some further nuance would be needed to make that be a usable system. If you then start to apply other rules, it brings in the problem of whipsaw again.
I agree that the results of the weekly GMMA “system” are not that great. For example, during 2009 and 2011, one would have struggled mightily.
I suspect that just following the GMI would yield better returns, but I don’t know what the backtested returns of the GMI system are, nor, more importantly, its realtime returns.