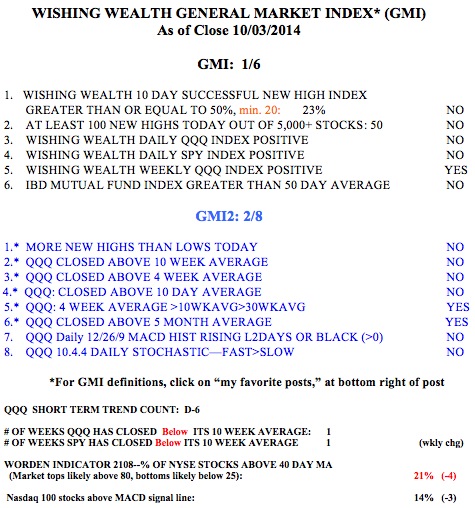
The GMI remains on a Sell signal and I remain largely in cash and hedged. I do hold a few biotech stocks, see discussion below. This market is rebounding from a high volume decline. It remains to be seen whether this rebound will retake prior peaks or falter somewhere before. This week is very critical for determining the significance of this bounce. I would want to see the QQQ close the week above 99.30. The QQQ is now below its 10 week average and I cannot make money on the long side when this is so. There were 50 52-week highs and 134 new lows on Friday. One possible sign of a meaningful bounce was the fact that the Worden T2108 hit an intraday low of 13% on Thursday. That is a very oversold level. Put/call ratios were also over 1.0, signalling extreme bearishness among option traders. IBD sees the market in a correction. However, it is just impossible to know in advance whether we have a “dead cat bounce” or a meaningful bottom. I will start to buy the TQQQ when and if the QQQ short term trend turns up….
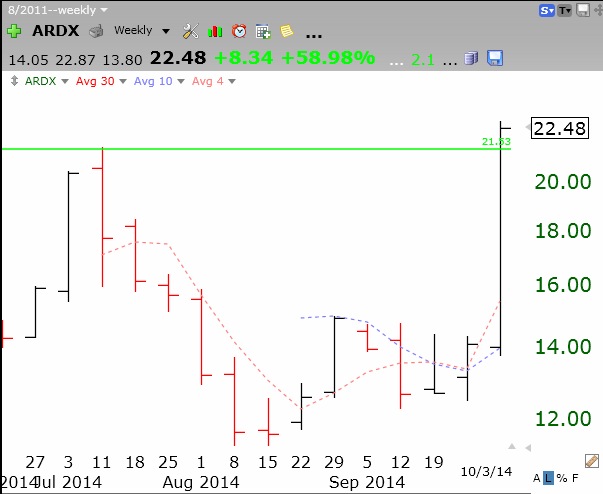
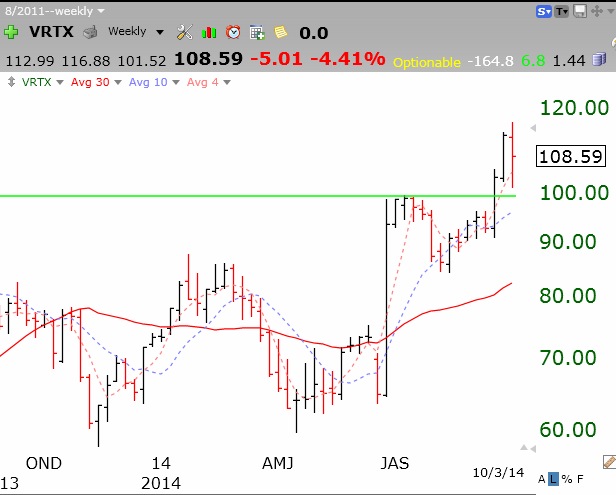
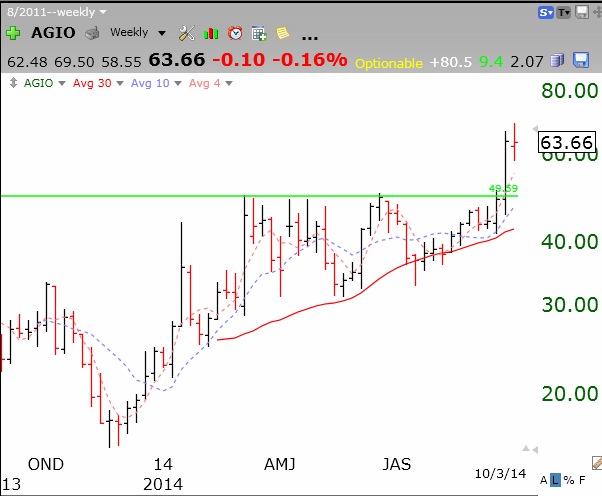
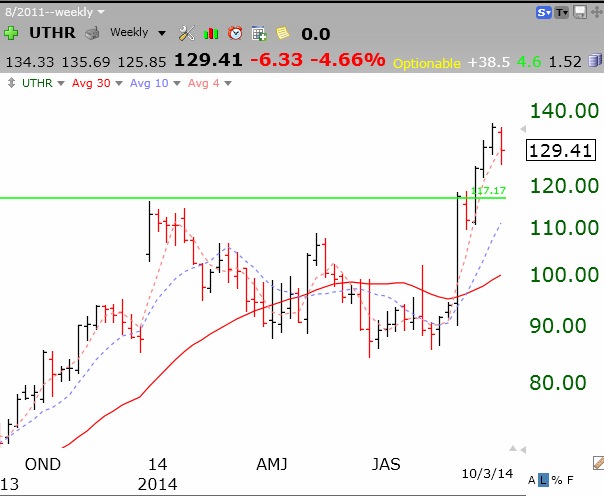
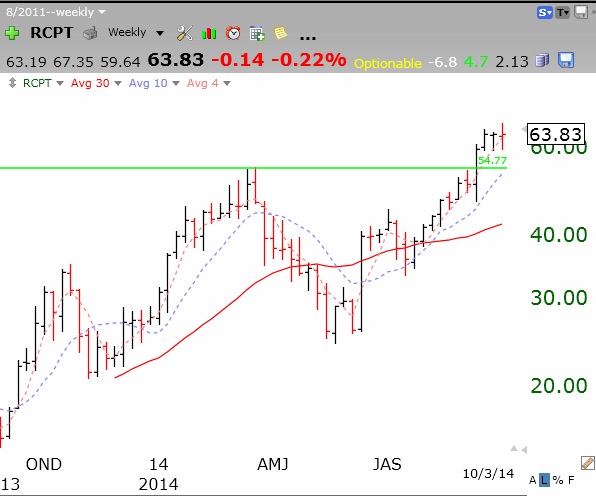
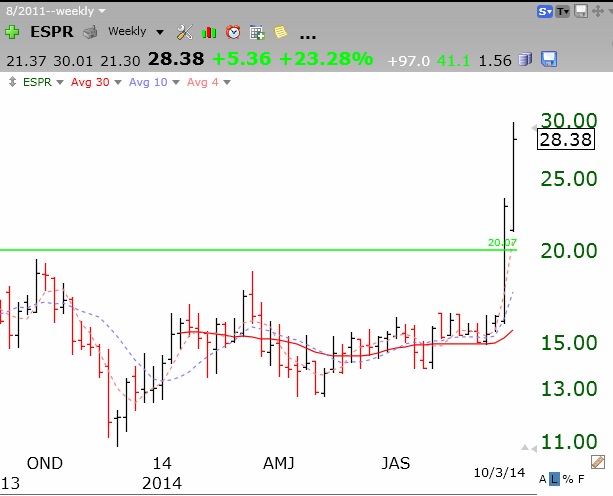
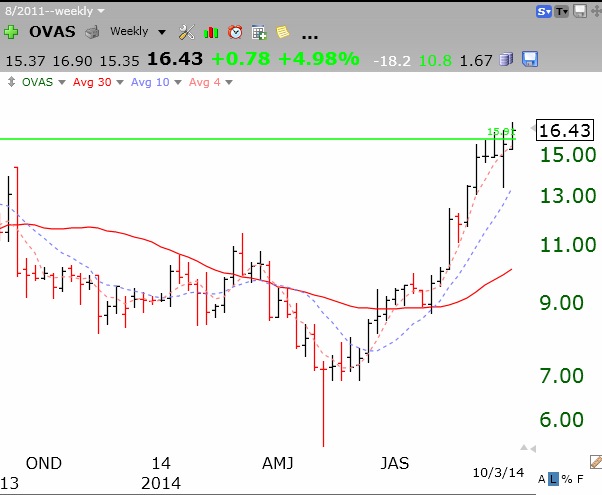
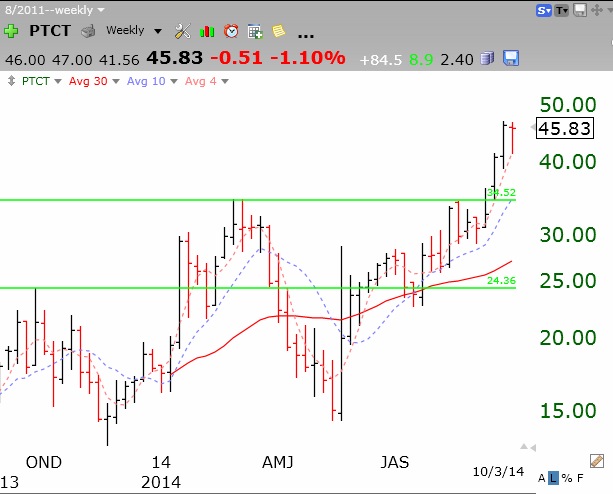
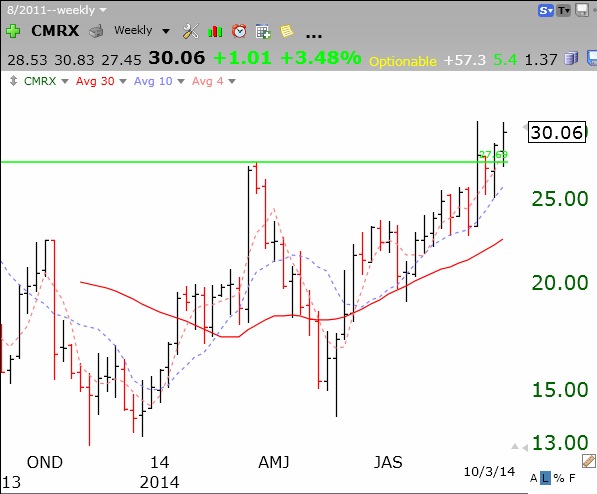
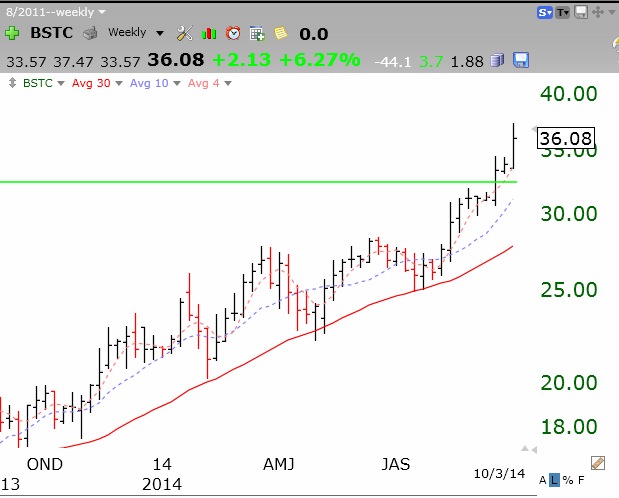
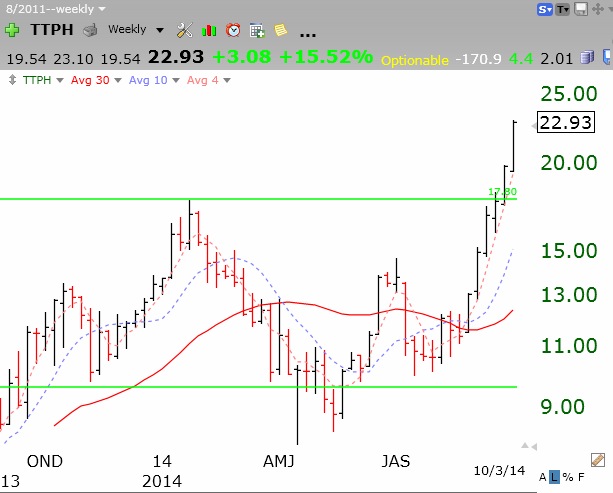
Meanwhile, my readers know that I have been focusing on the bio-tech area. There are so many discoveries occurring in drug research that this is one area that can buck the market trend. I have been scanning bio-techs each day for high volume break-outs. I then look at monthly charts to see whether each is near a “green line break-out” to an all-time high. When a stock breaks above a high multi-month (at least 3 month) base, it often means something important is occurring within the company. Here are some weekly graphs of biotech stocks that have come to my attention. Somewhere among these may be a company with the next new cure for a major disease. These companies are worthy of further research ( a review of recent news stories often explains why the stock surged) and monitoring for possible purchase. If any of these decline below their green line, I become less interested in them. One approach I like is to buy a few shares (up to 25) of each just to keep them on my radar screen. I then slowly add more to those that prove themselves and exit those that fail. I am looking for multi-month or year long moves, not for a short bounce. Click on a chart to enlarge.
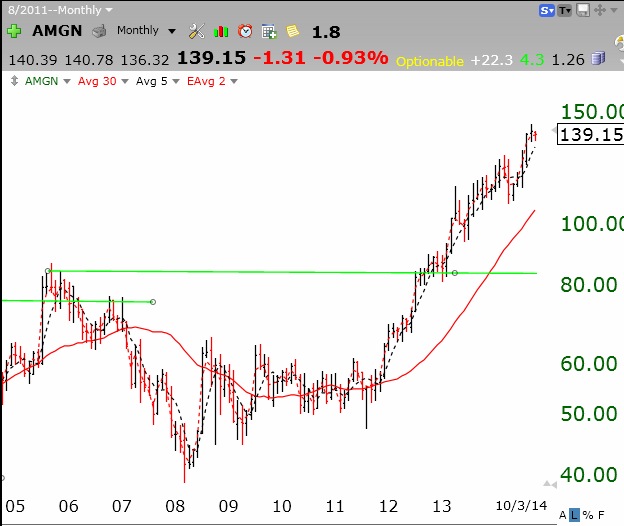
When a stock breaks out of a monthly, green line top to an all-time high it can be the beginning of a huge move. As an example, look at this monthly chart of AMGN in 2012. Note also what happened after a failed green line break-out in 2006. When a stock comes back below its green line, it is a sign for caution. But a stock can fail, find support at the break-out, and then resume its rise.