Yes, the QQQ remains in a short term down-trend. Only time will tell if this rebound is a real end to the correction or just a bear trap. Typically, down-trends don’t end so suddenly, and without panic. But if the GMI returns to 4 or greater for two days, I will go long again. The important thing is to wait for a definitive signal of a change in trend. IBD still calls the market in a correction.
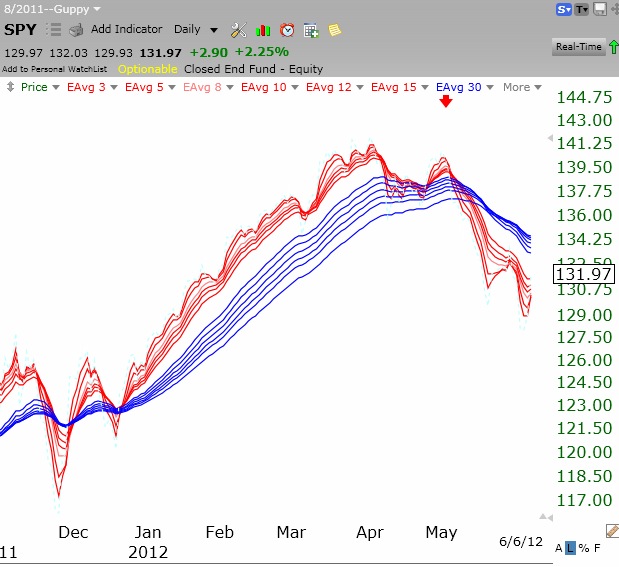
The daily Guppy chart of the SPY shown below shows that the S&P 500 stocks remain in a solid down-trend. Note that all of the short term averages (red) are well below the declining longer term averages (blue). Compare this pattern to that in the prior up-trend. The fact that we are still in a down-trend should be very obvious. When the red lines are back above the rising blue lines, it pays to be long and fully invested.
is there a public web site ( freestockcharts.com or stockcharts.com?) where you can get these Guppy charts — I find these charts very useful. are these same as GMMA charts you talk on other blogs.
Dr. Wish,
Would you share all of the period moving averages used for the SPY Guppy Chart? I am tyring to reproduce the chart.
Your website was recently brought to my attention by a memeber of finacial service. I am very intrigued with your analysis and look forward to your daily updates.
Thank you,
Mike
You can create Guppy charts at any free charting site that allows you to plot multiple exponential moving averages.
The GMMA are 12 moving averages with the following values: 3,5,8,10,12,15 and 30,35,40,45,50,60
They can be plotted on a weekly or daily chart.